
GRID INPUTS
Statement
Grid inputs are shared among digital and textile outputs. “Invisible” charts, like paper graphs with blocks of colors, or matrices with numerical values, output data in a similar fashion: as individual, color-coded pixels or stitches arranged specifically on a larger grid (in the form of a textile or digital display). By creating work in these mediums, I am demonstrating the shared origin in textile design and computational data storage.Background
Grid inputs became an accidental but necessary aspect of my process, starting with the knitting machine. I started by gridding the shapes of a garment and the colors of an intarsia design on graph paper. I used the Brother KH-891 machine, a non-electronic machine that uses a punched card for input. I experimented with punched cards, but became frustrated with the limitations of the design. Designs can be made a maximum of 24 stitches wide.I later acquired an electric Brother KH-910 machine, which uses a larger, more modern input - a mylar card, or mylar sheet. This allowed me to work with a larger amount of pattern data. The mylar sheet can hold a design 60 stitches wide by 150 stitches tall. These dimensions became helpful constraints in my work and eventually determined aspects of Tigerbob Playing Cards, Undulation, and Tigerbob Mystery Garden.The electronic hardware on these machines are more than 40 years old and prone to breaking down. It was not long before the mylar card reader became unusable. I replaced the card reader for a hardware/software hack called AYAB. This community project was created to provide alternative control of the Brother KH-9xx series with a computer as the input.Working my way up from manual hand-charted graphs to non-electric punched cards, then to electronic mylar card readers and finally to the AYAB hack, gave me insight about how textiles and their corresponding grids became instrumental to the design of data storage and modern computing. Working back and forth along this chain of digital art and physical outputs made me realize they are both parts of the same whole. “Invisible” graphs or charts, in the form of matrices with numerical values, or blocks of color represented on paper, are interchangeable with their digital or physical counterparts.Research
A number of textiles are represented by colored marks on paper, like weaving drafts and counted-thread embroidery; however, these charts must be manually read and translated directly by human operation. It was not until the invention of the jacquard loom that charts became readable by machinery, in the form of the first punched cards. It was interesting for me to discover that Susan Kare, one of the artists who designed work for the early Macintosh computer, created the work with textiles in mind. Susan Kare had no prior experience working with computers, and found inspiration from what she knew (quote below).Presentation
On this page you will find a selection of grid inputs I use in my work. I also include examples of how these grids appear output as knitted structures or digital art.INTARSIA CHARTS
MYLAR SHEETS
COMPUTERIZED INPUT (AYAB)
GRAPHS FOR DIGITAL OUTPUTS
PROTOTYPE: CTRL+C, CTRL+V AND GOOGLE SHEETS
Further Reading
DESIGN & PROCESS: Review the DESIGN: PIXEL ILLUSTRATIONS section of this page for a behind-the-scenes look.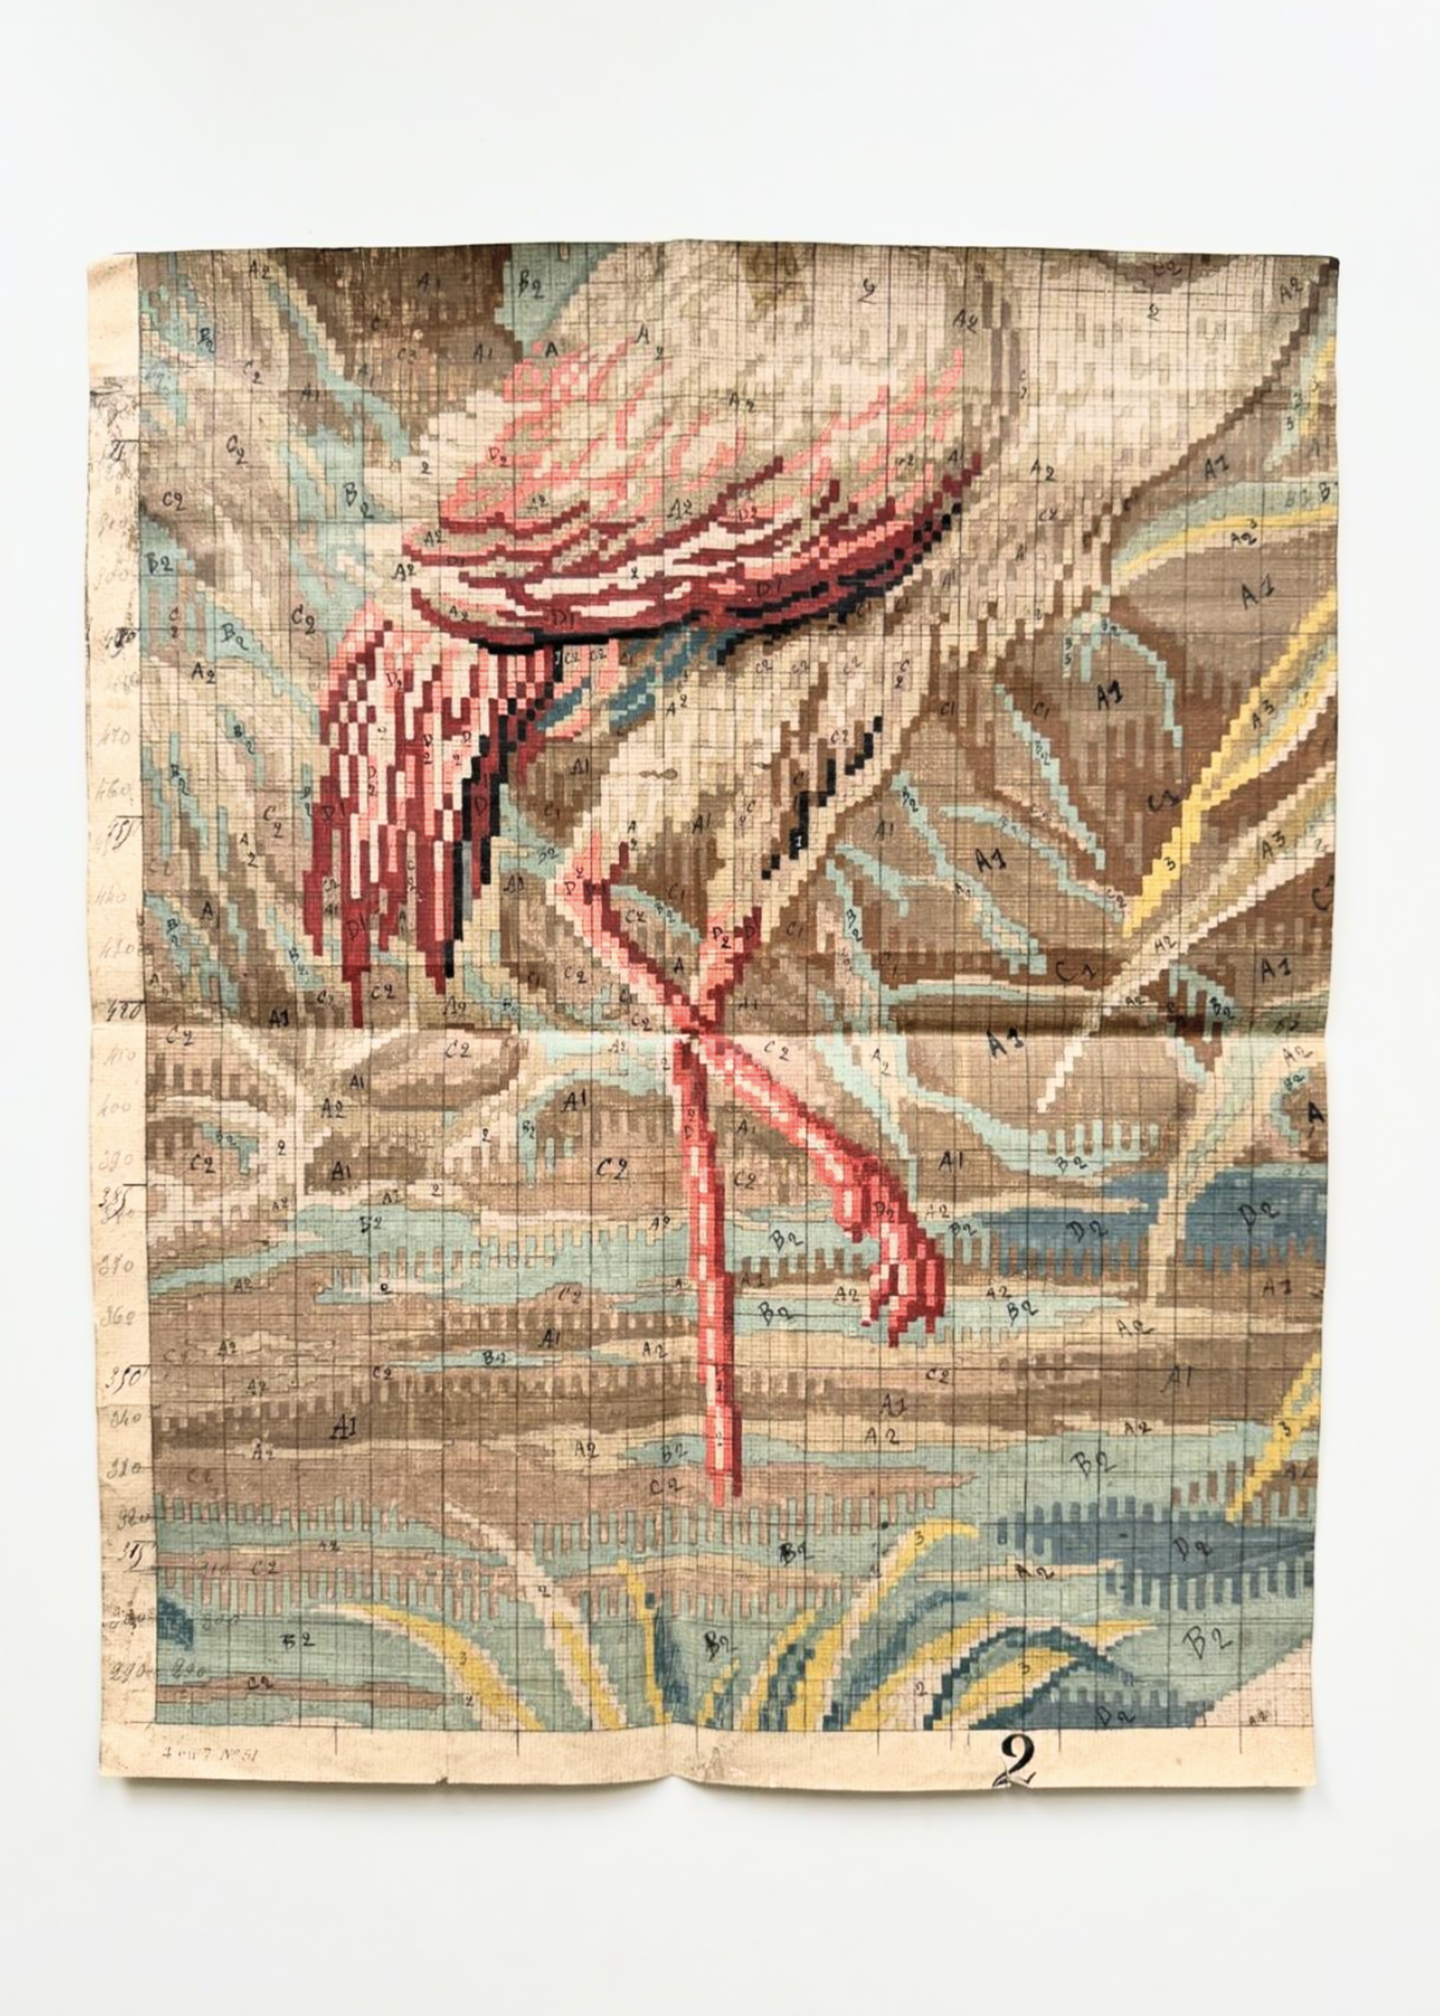
19th century hand painted French textile pattern/chart.
(courtesy of Tihngs)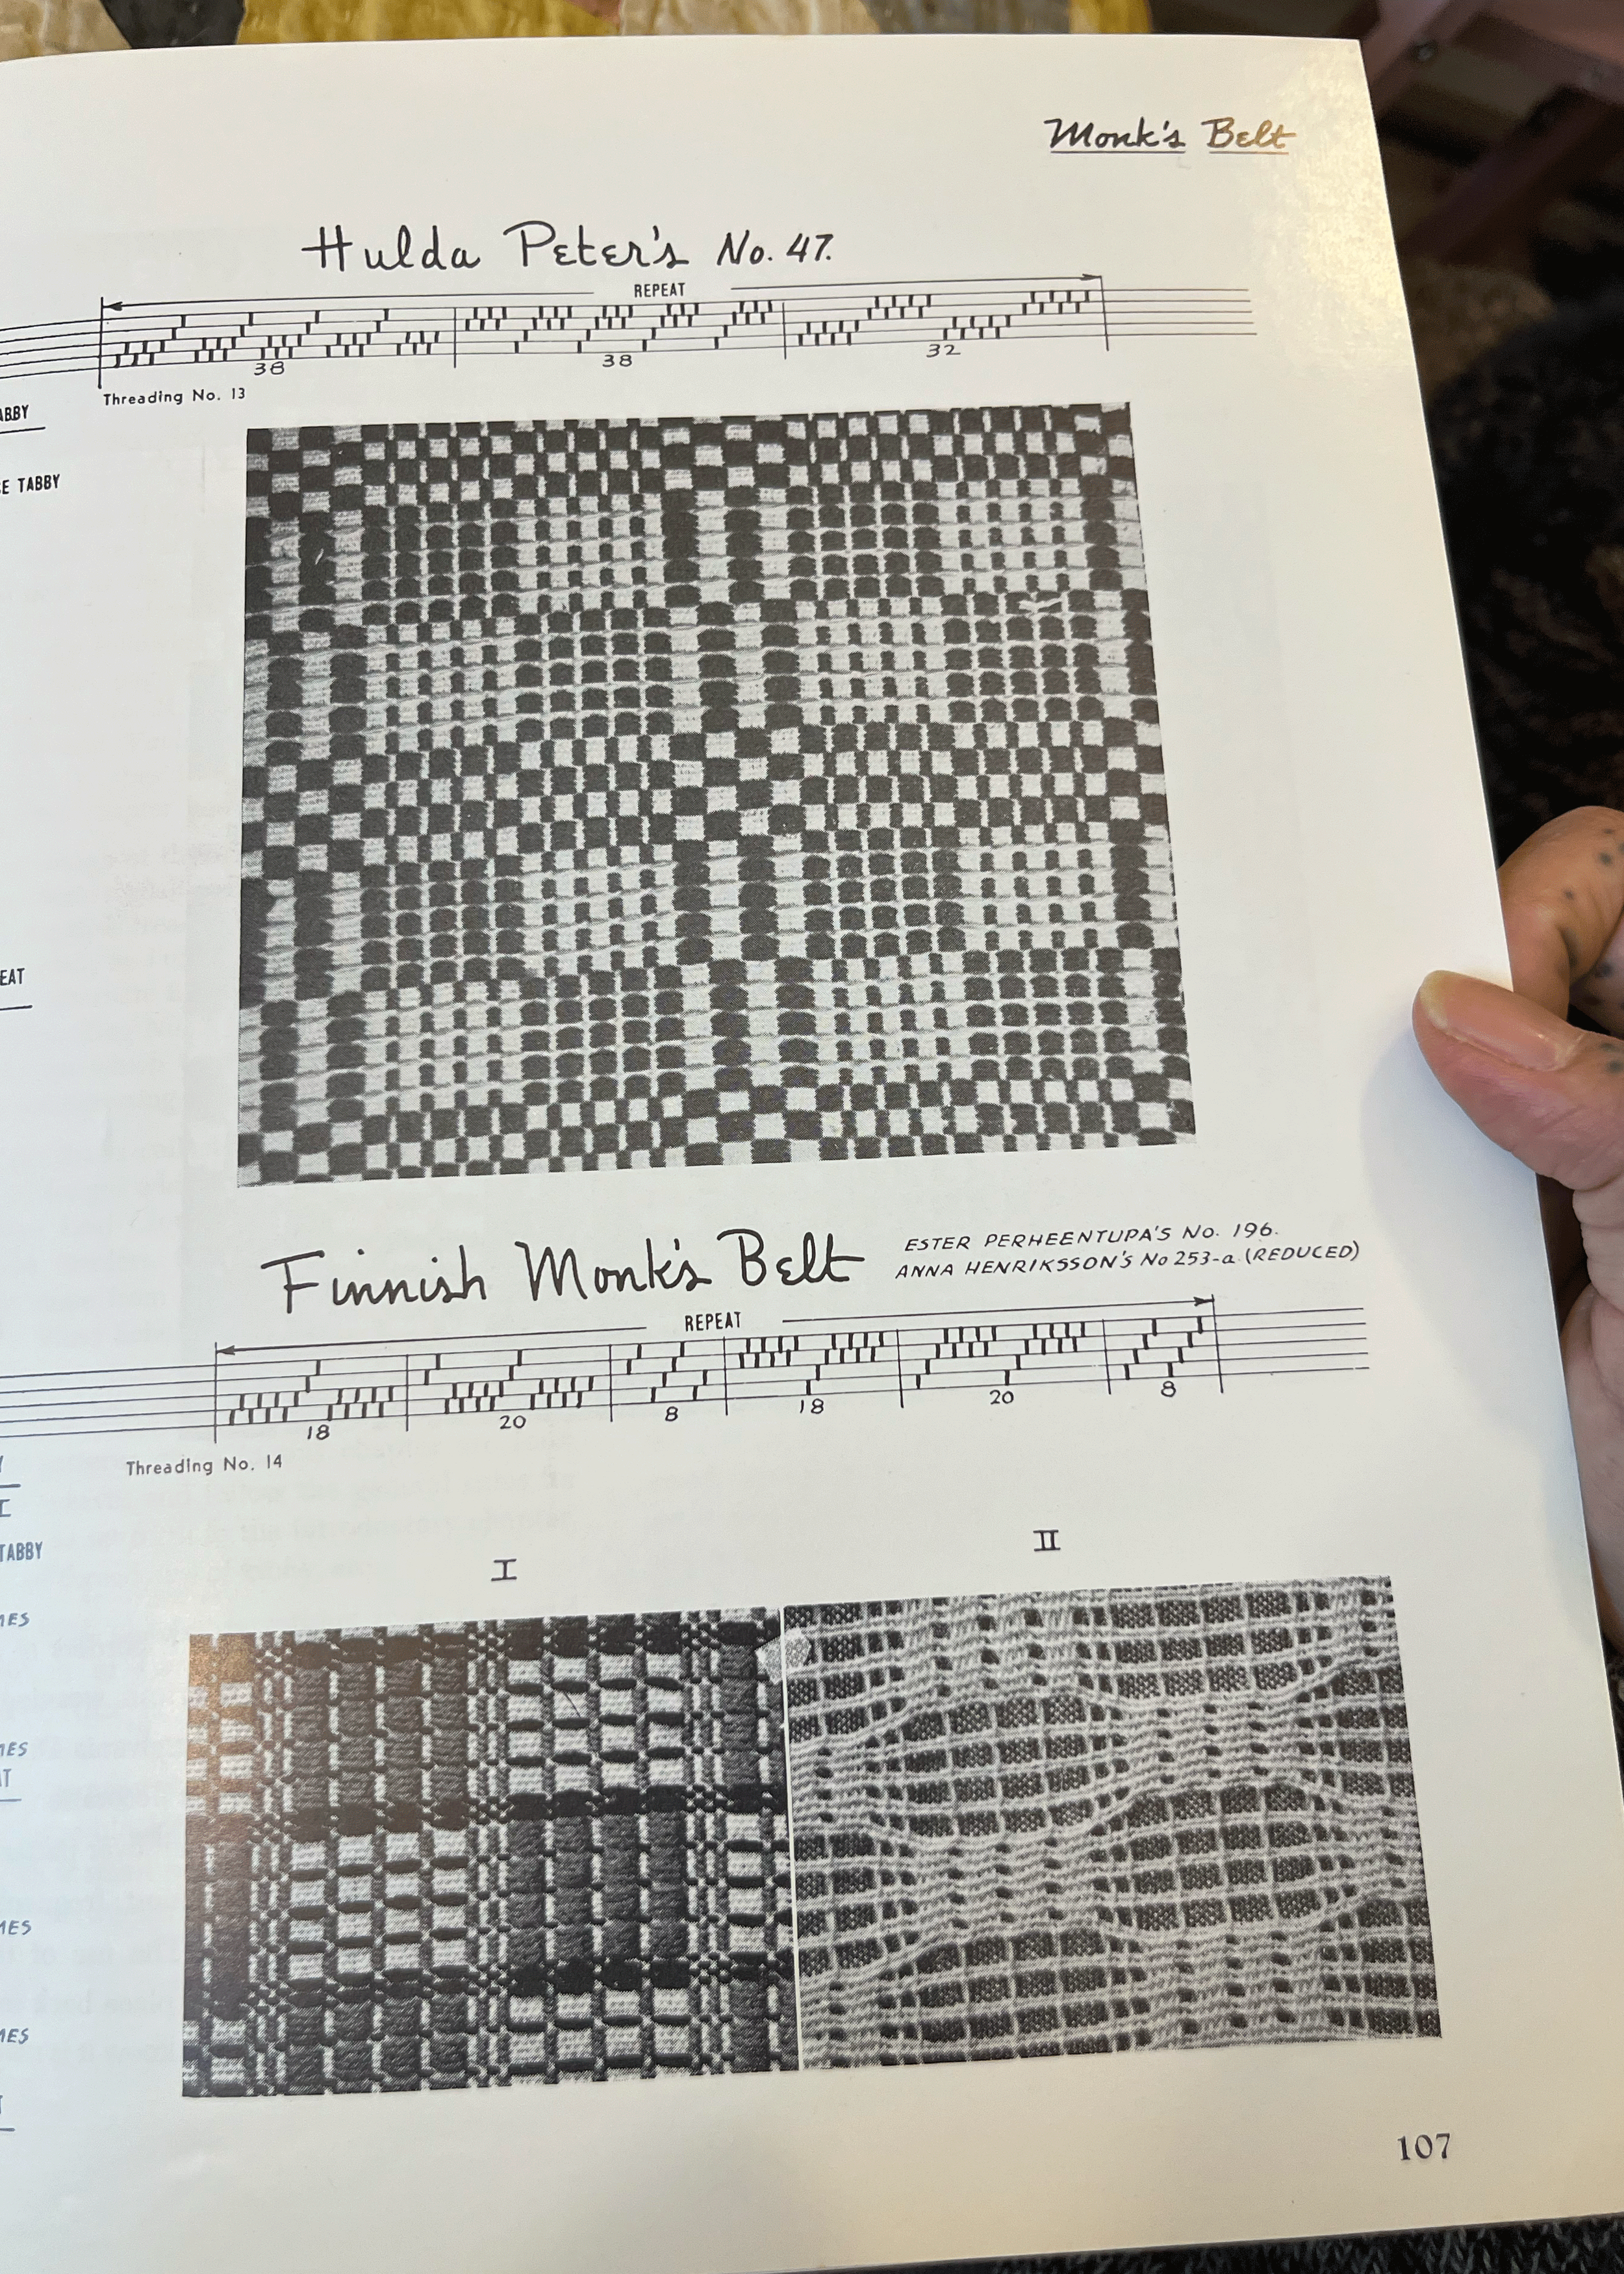
A page from a book a weaving drafts called “A Handweaver’s Pattern Book, Revised Edition” first published in the 1940s by Marguerite Porter Davidson.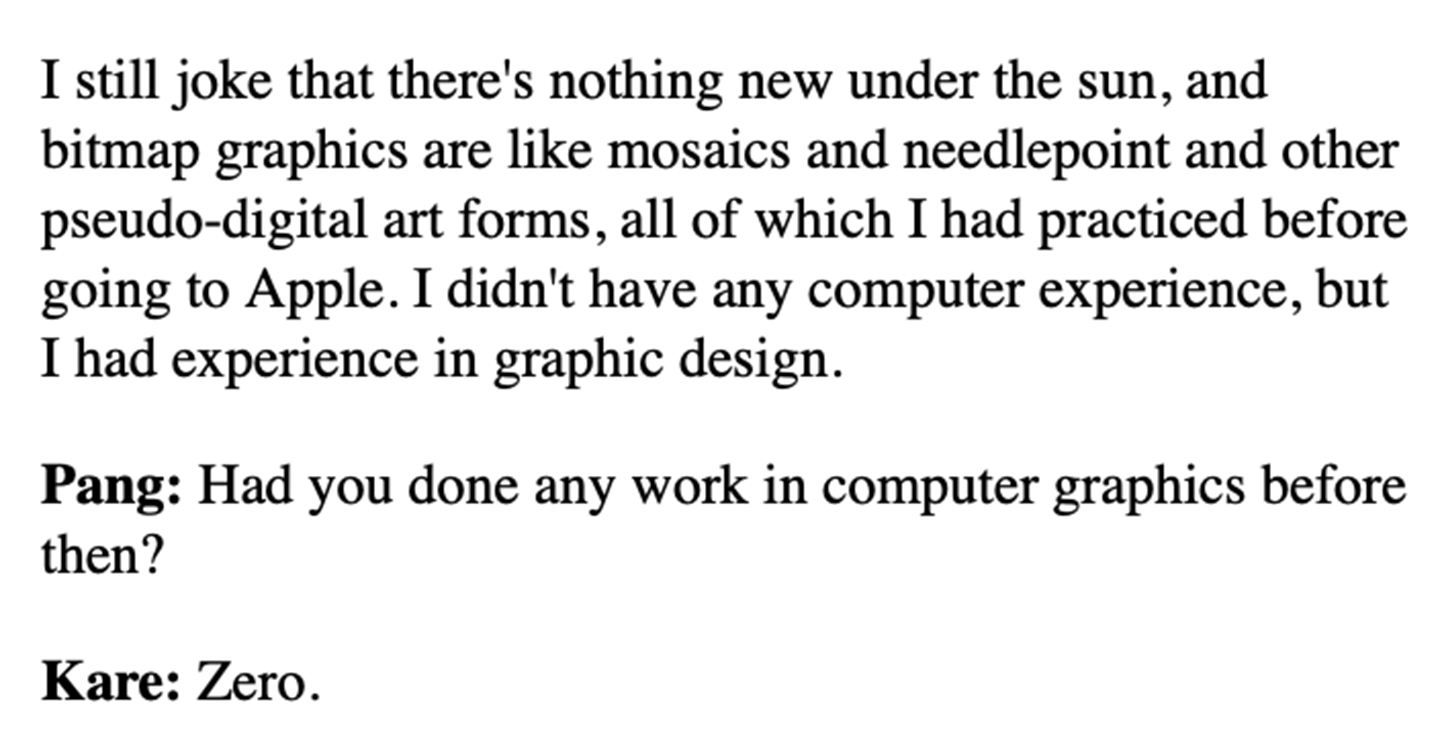
Except from Alex Soojung-Kim Pang “Interview with Susan Kare.” Making the Macintosh, February 20, 2001. INTARSIA CHARTS
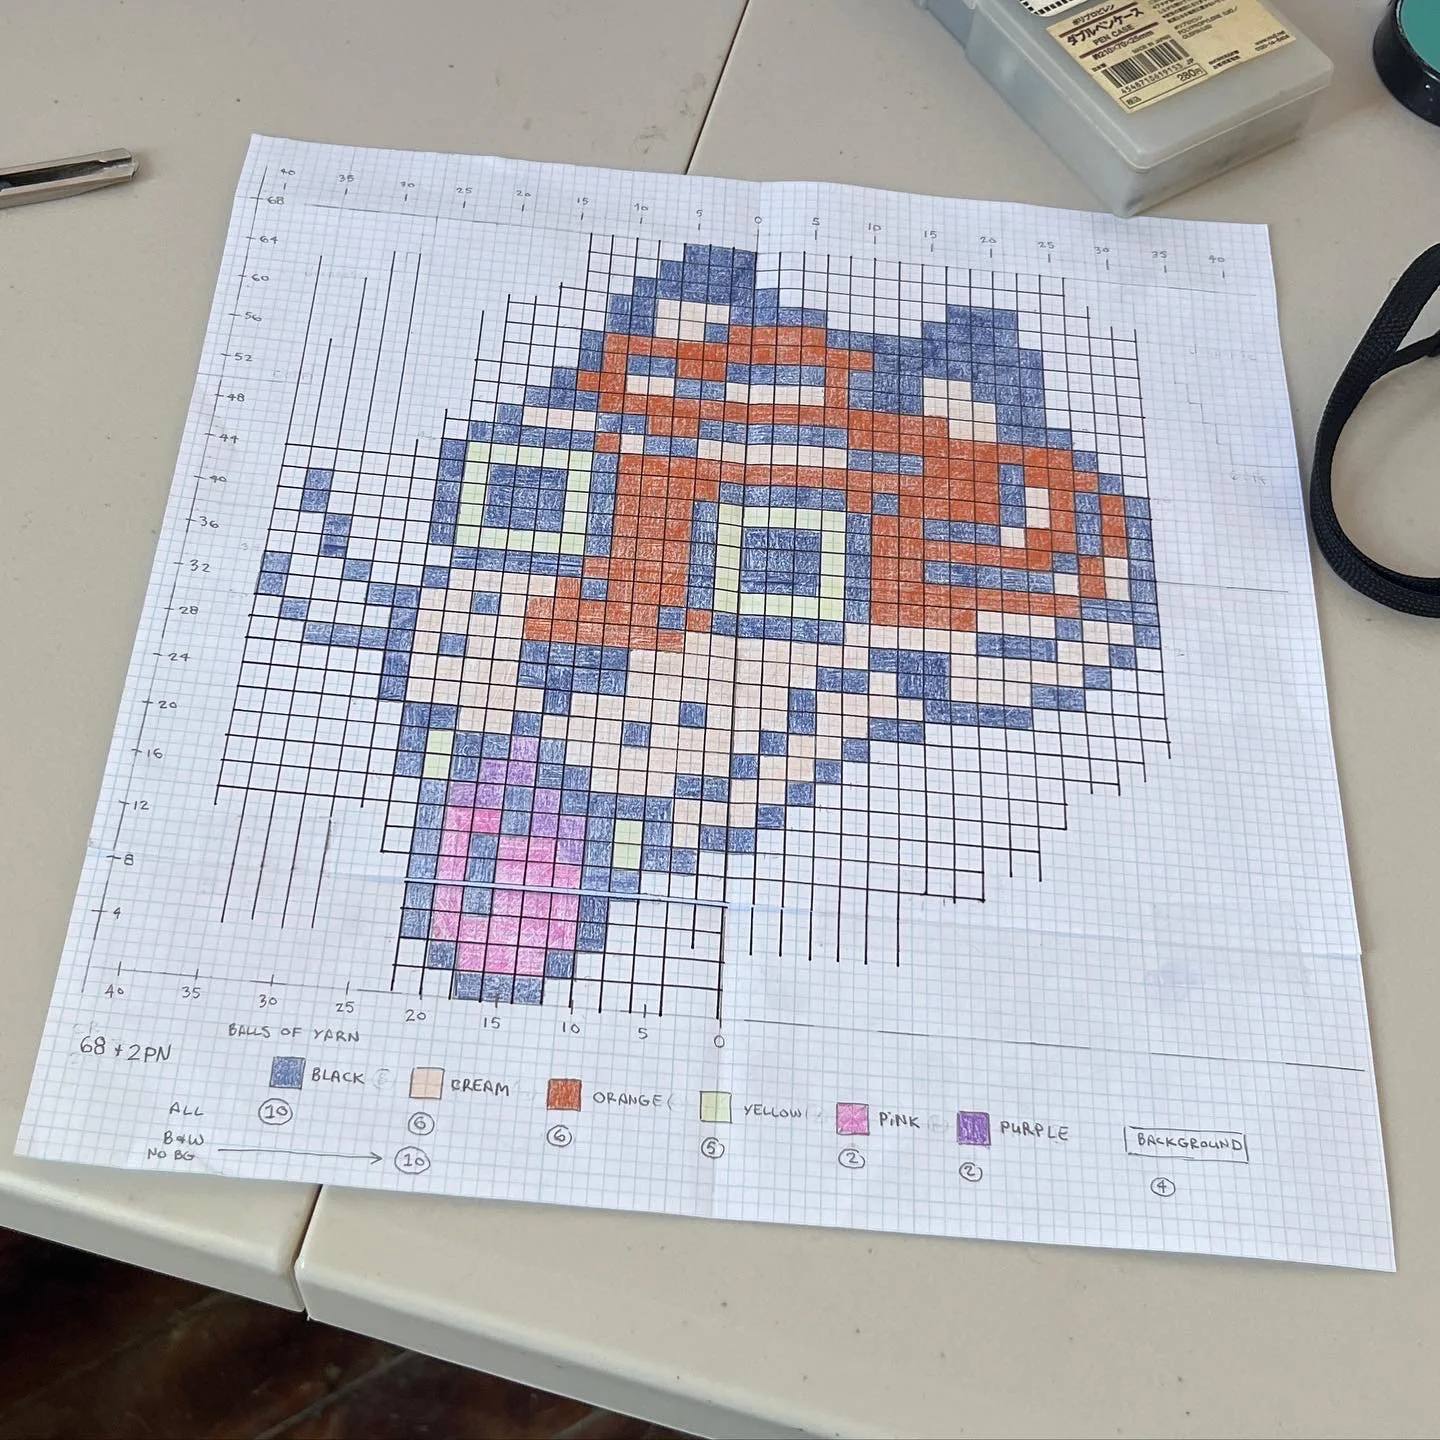
One of my earliest hand-drawn knitting charts for intarsia knitting (2022).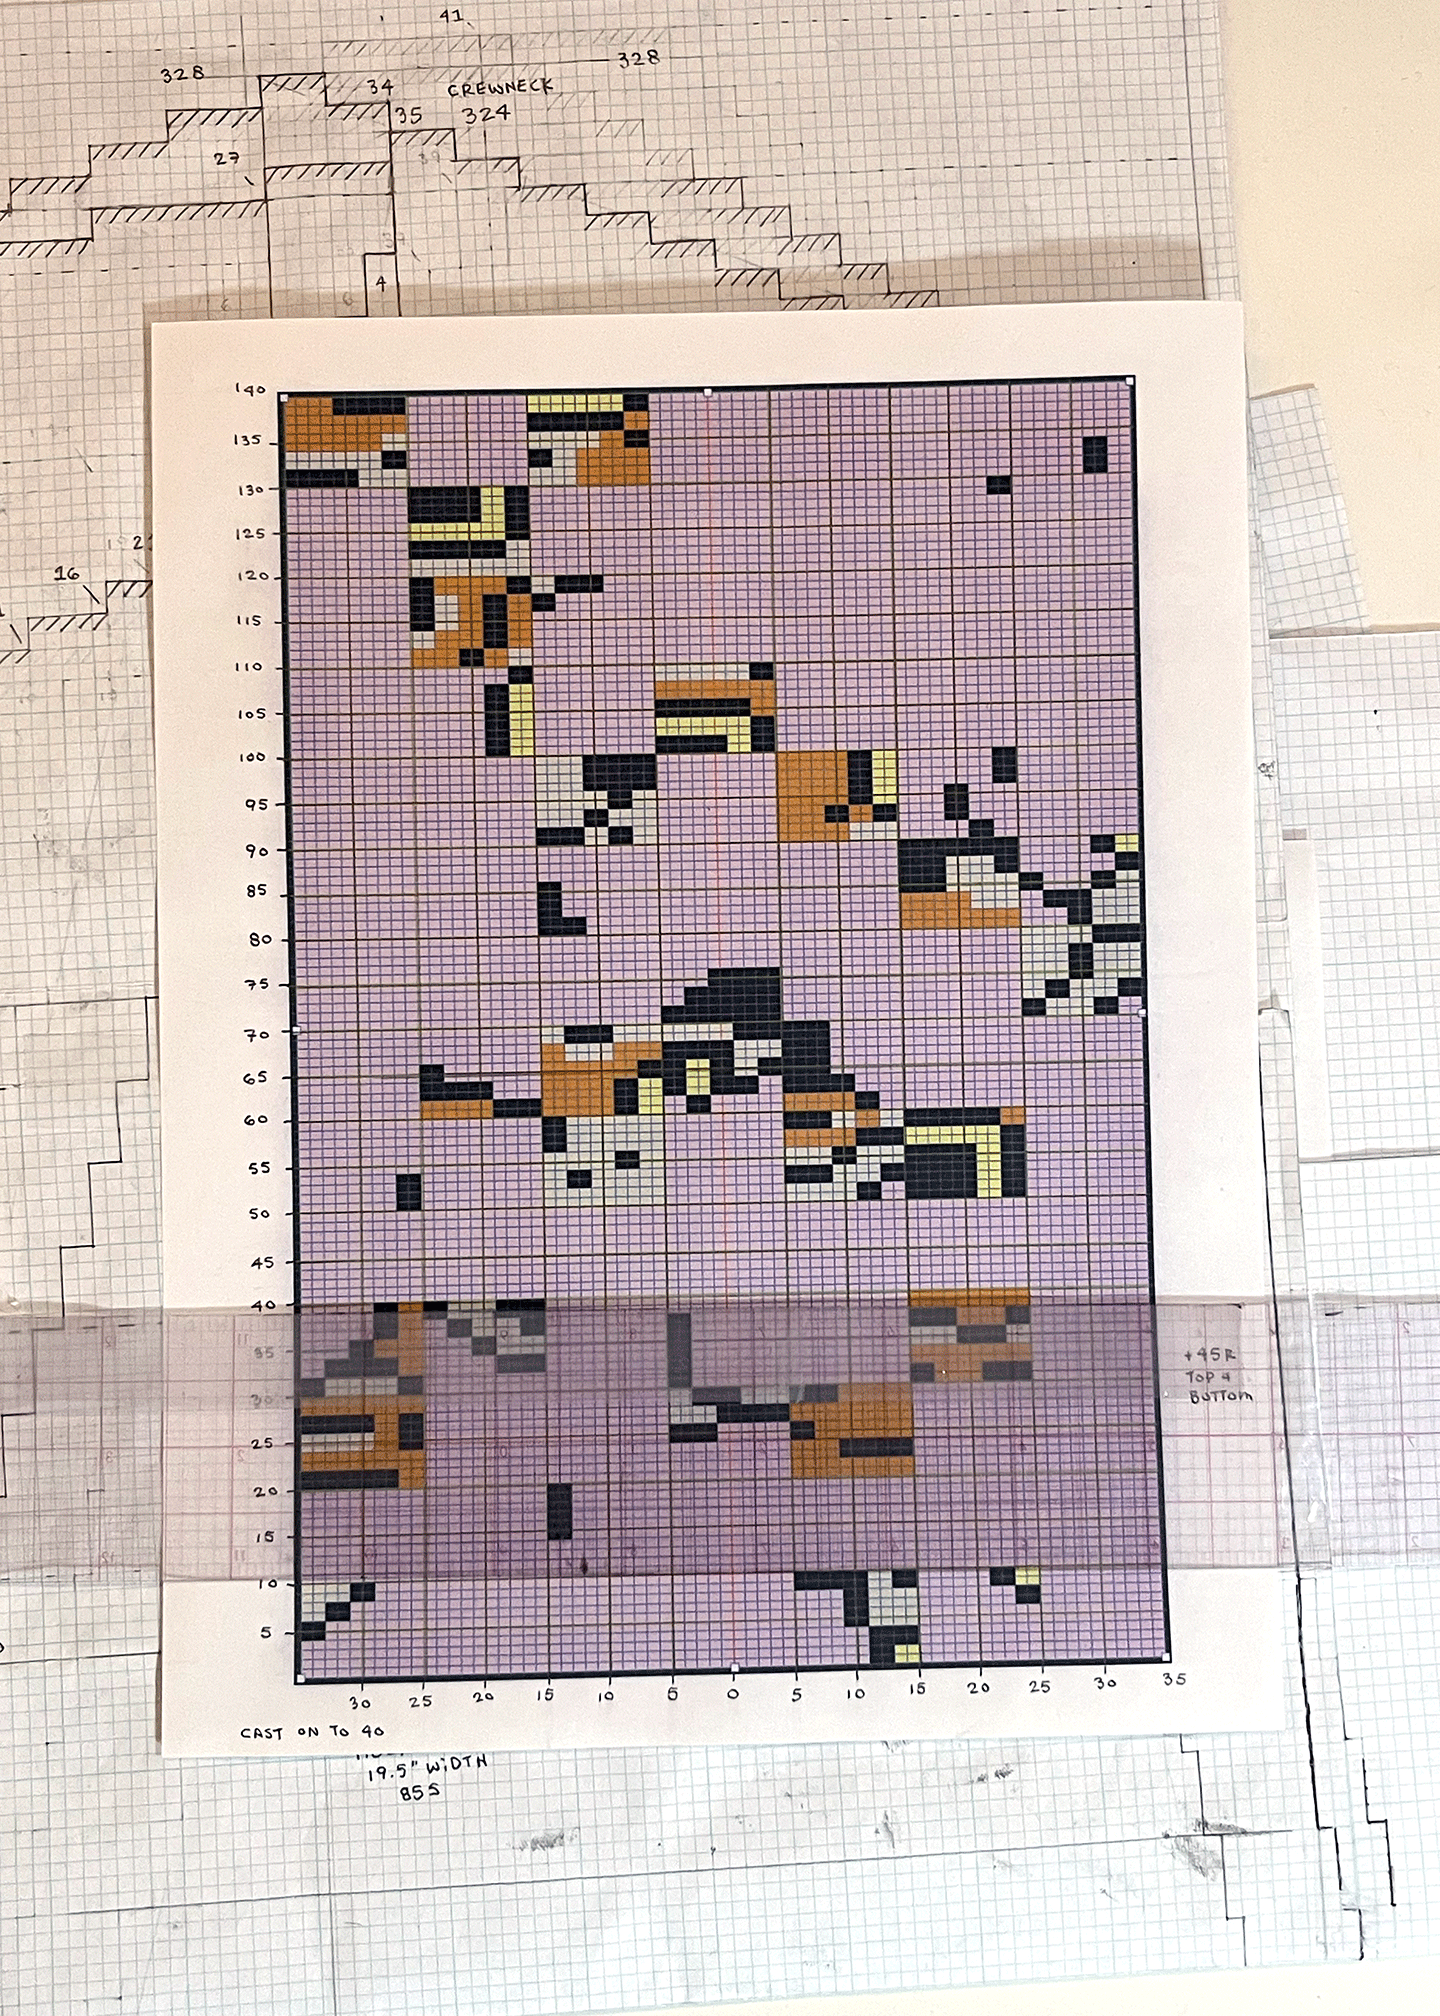
A printed, gridded chart for a complex intarsia design. Behind this chart are hand-drawn charts for the construction & shape of pieces of a garment (2024).
A modified digital interface (created in Adobe Photoshop) highlighting the current row of colors to be selected, and a photo of the knitting machine with corresponding colors laid over needles, waiting to be knit in.Please see MACHINE KNITTING and INTARSIACORE for examples of pieces completed with this grid input.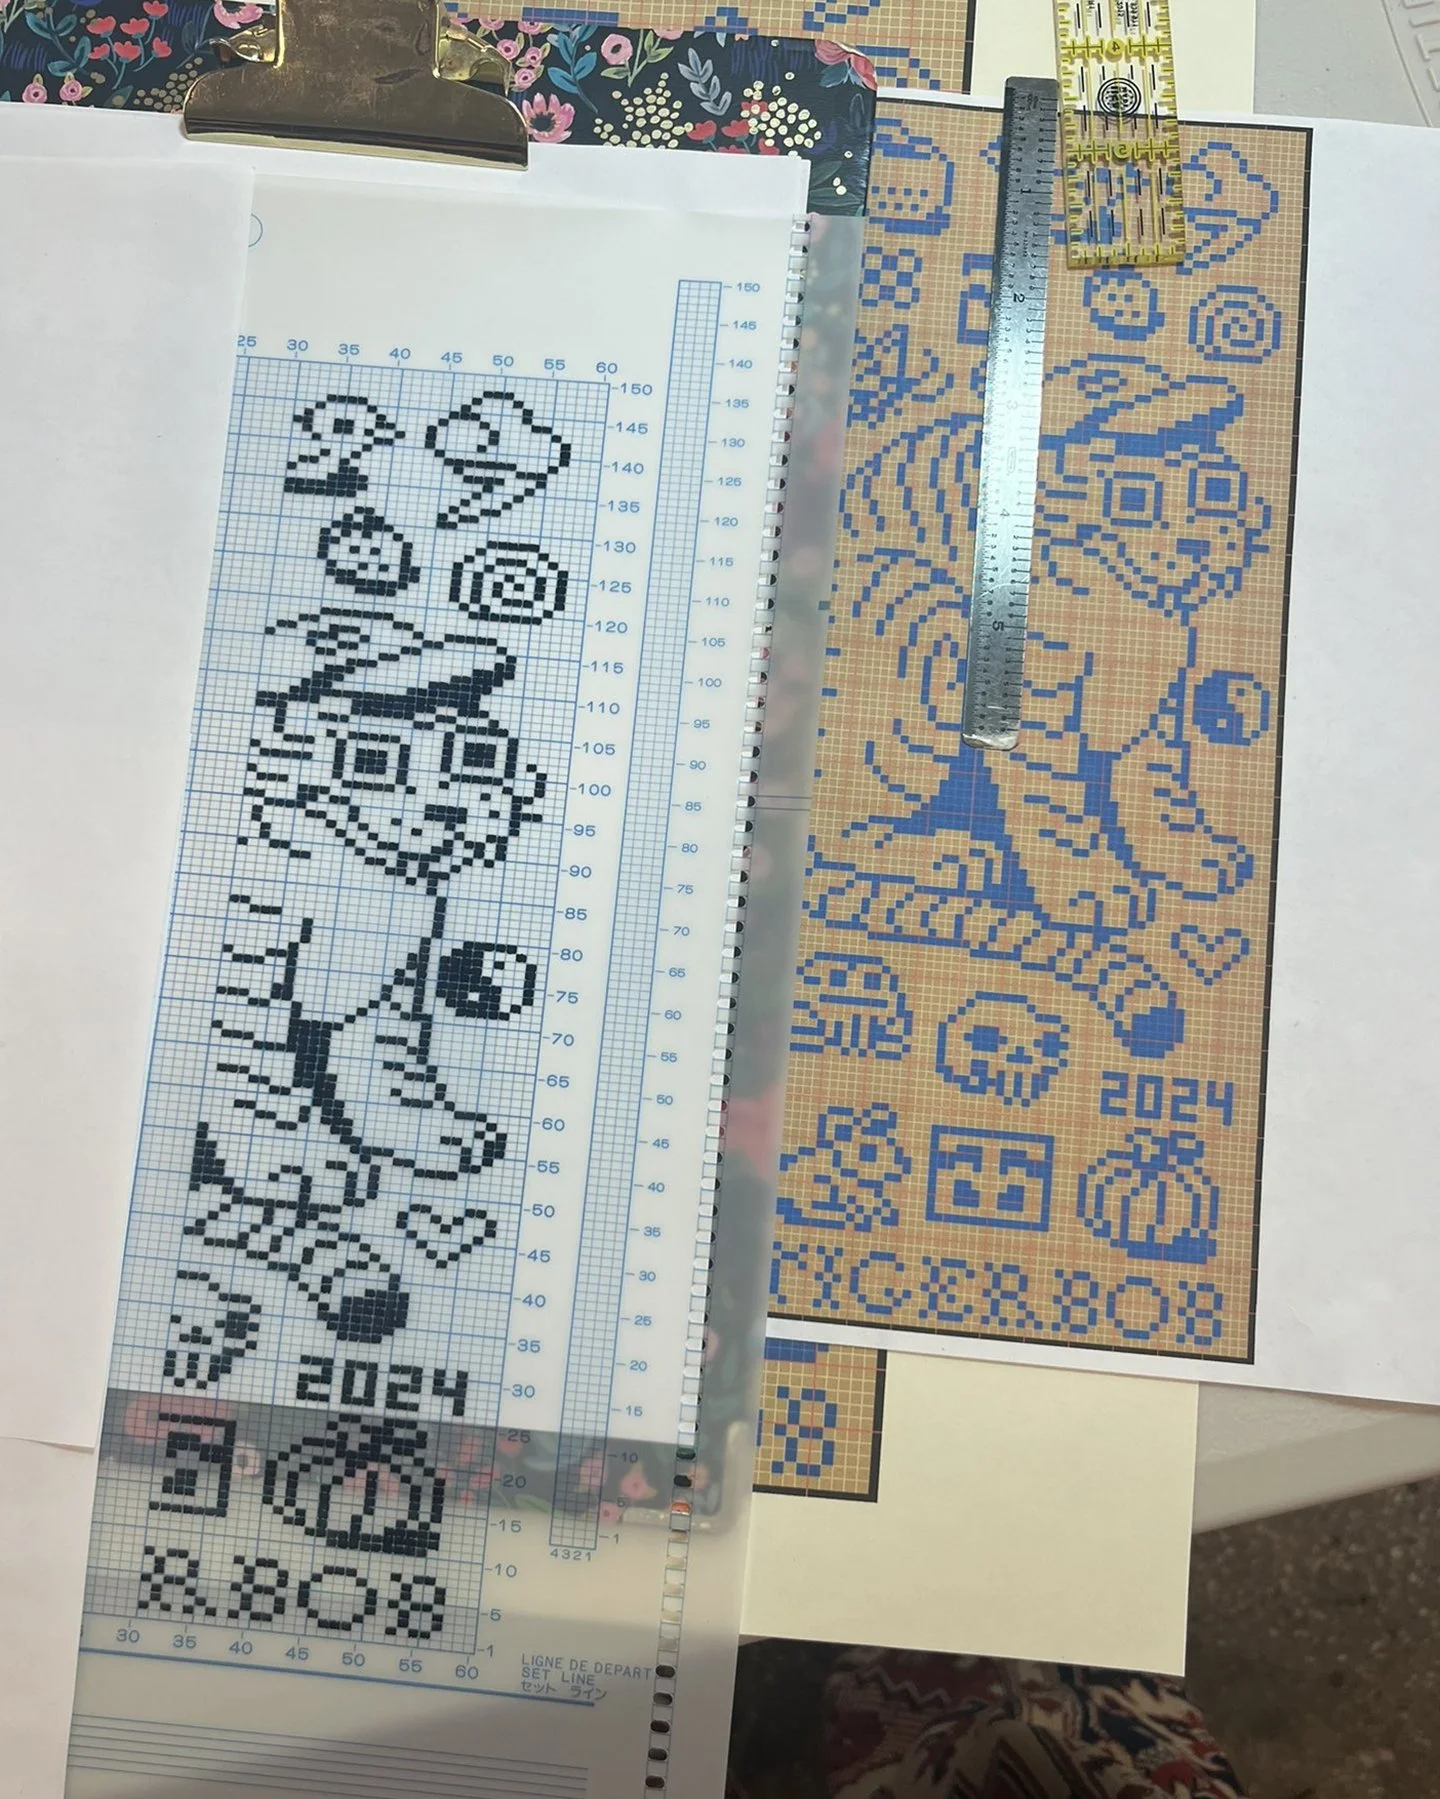
MYLAR SHEETS
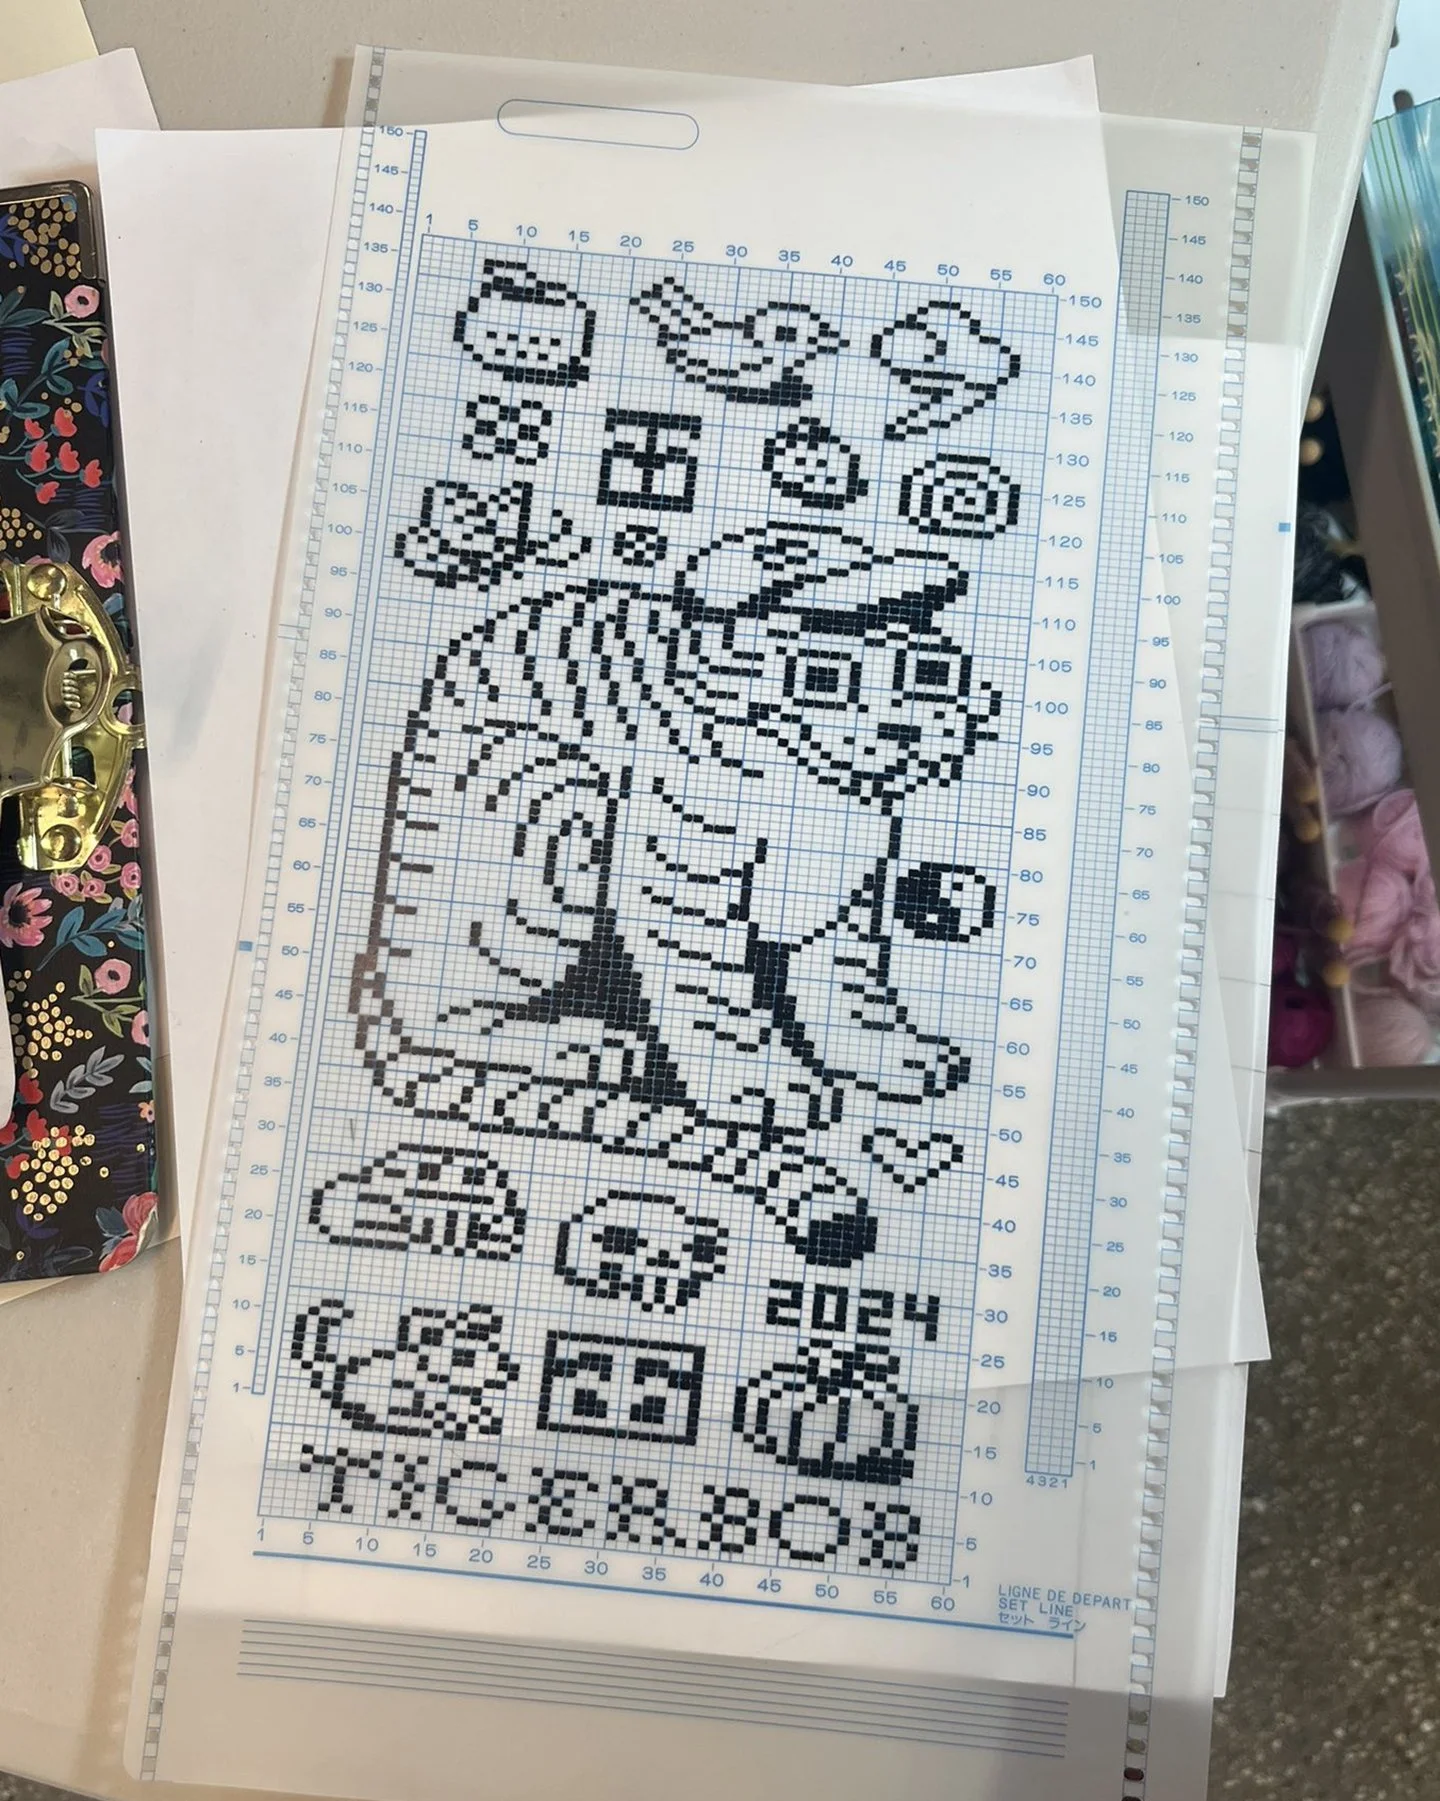
A mylar sheet in progress (left) and finished (right) (2024). Black squares must be filled in by hand and represent a selected needle that will create a stitch in the alternate color. An unfilled square is no needle selected. (See binary code)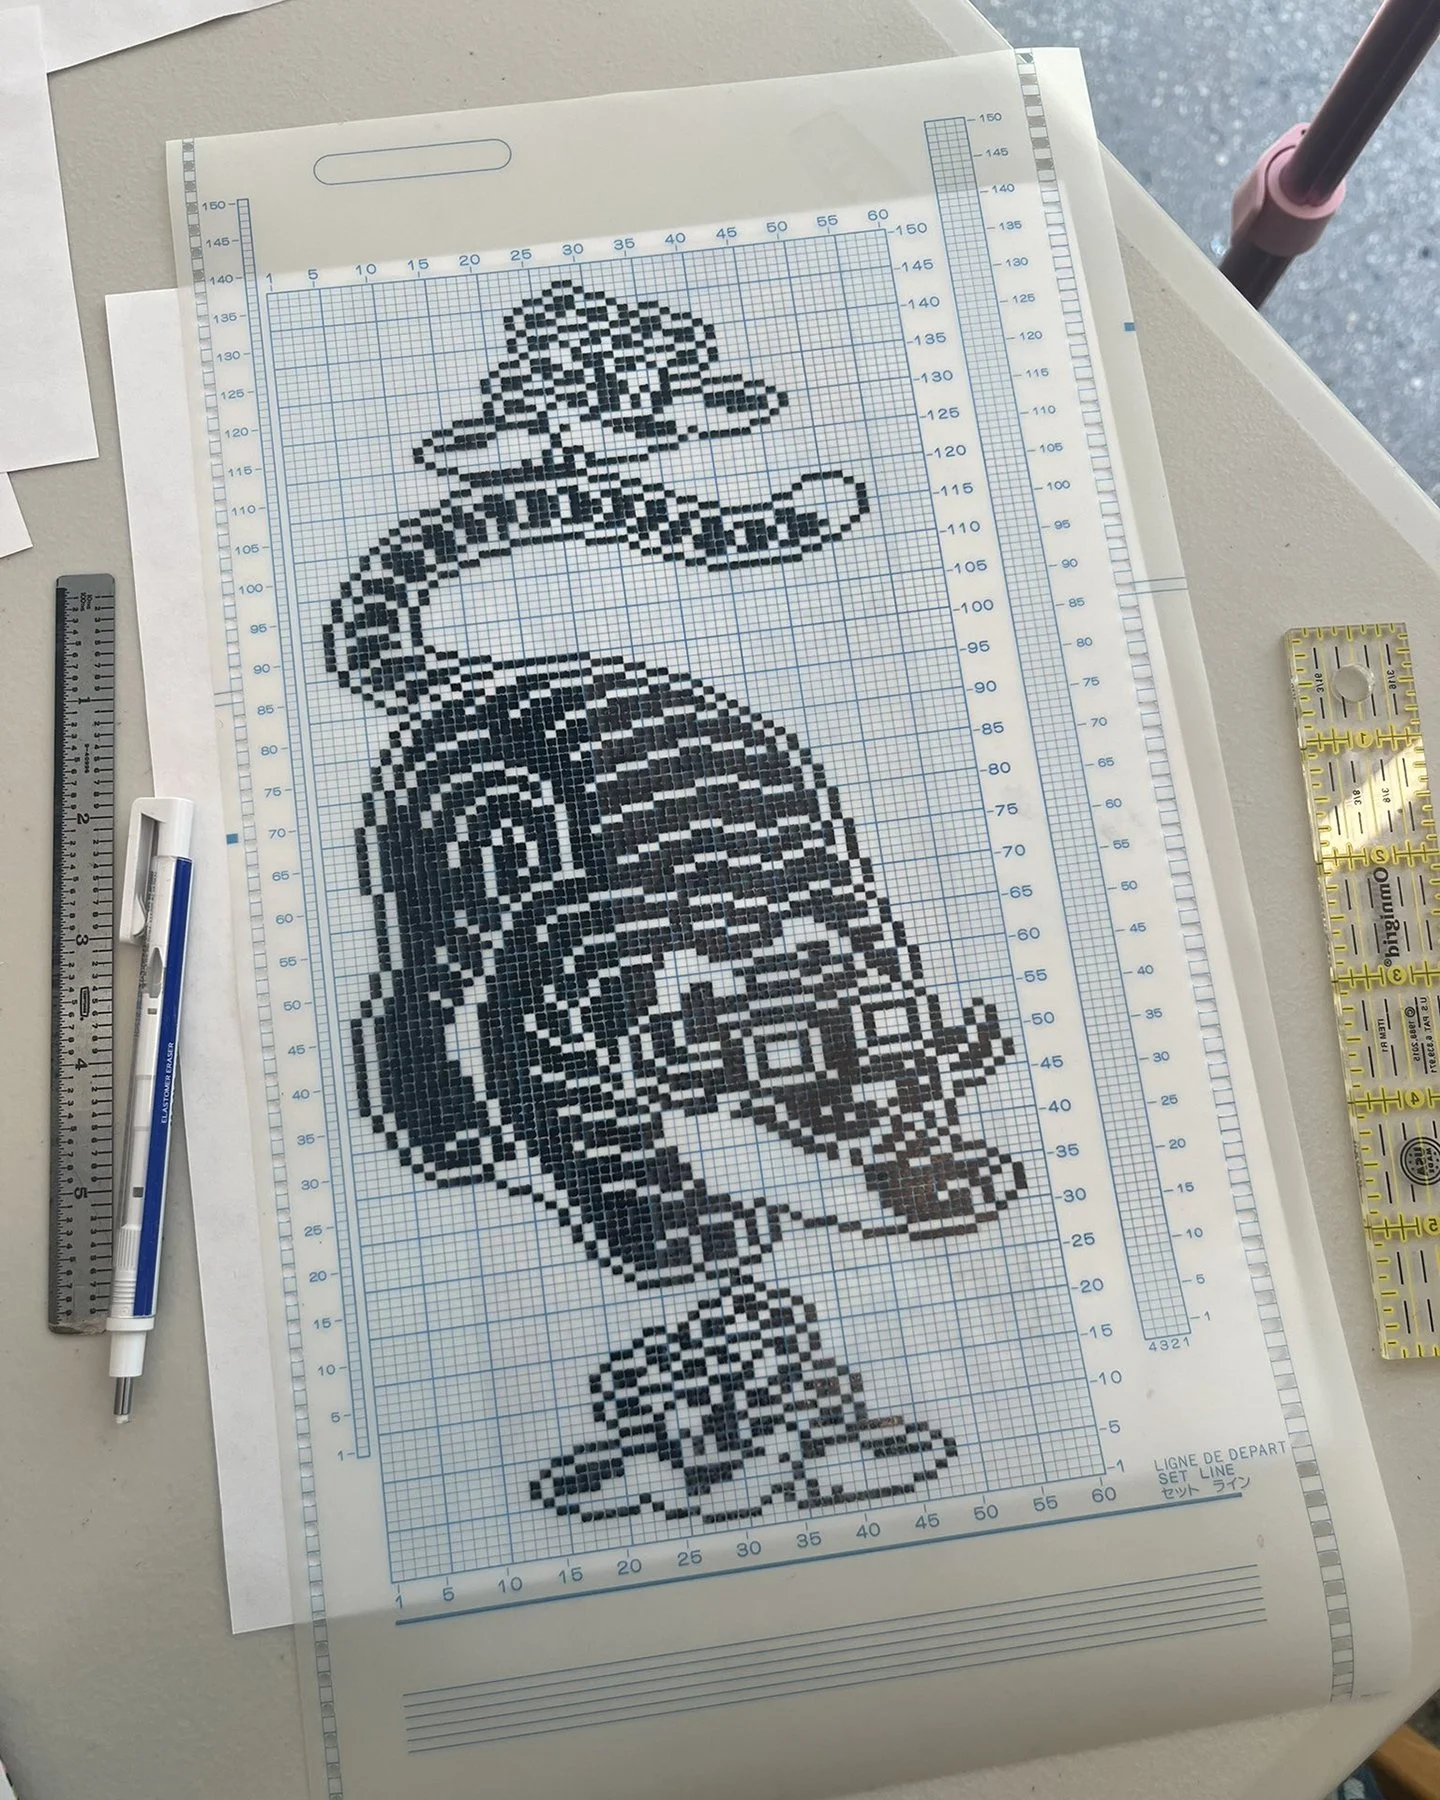
Completed mylar sheet.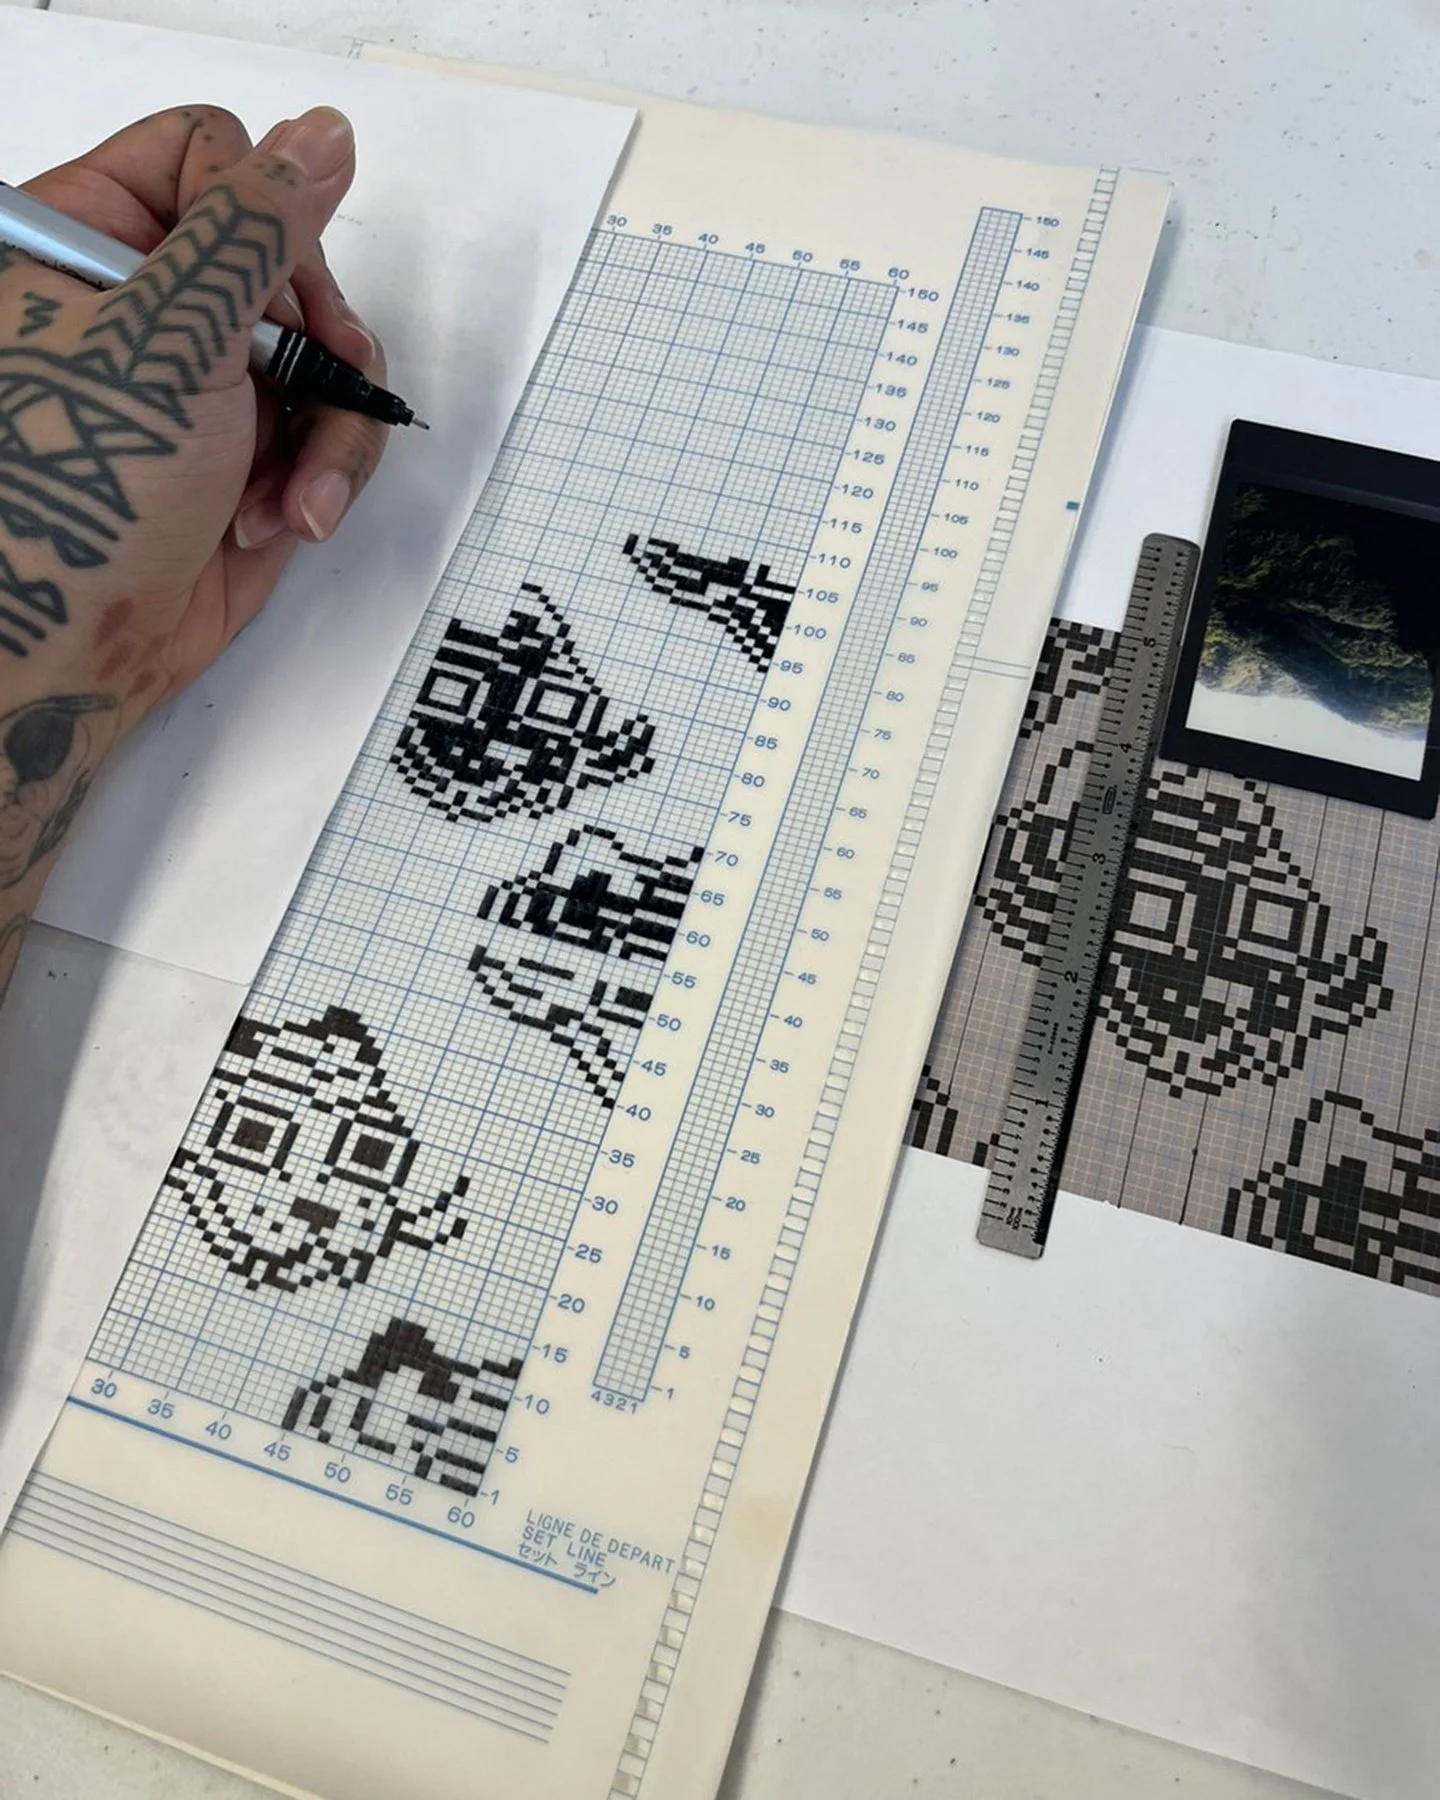
A mylar sheet in progress (above) and read by the knitting machine’s computer (below).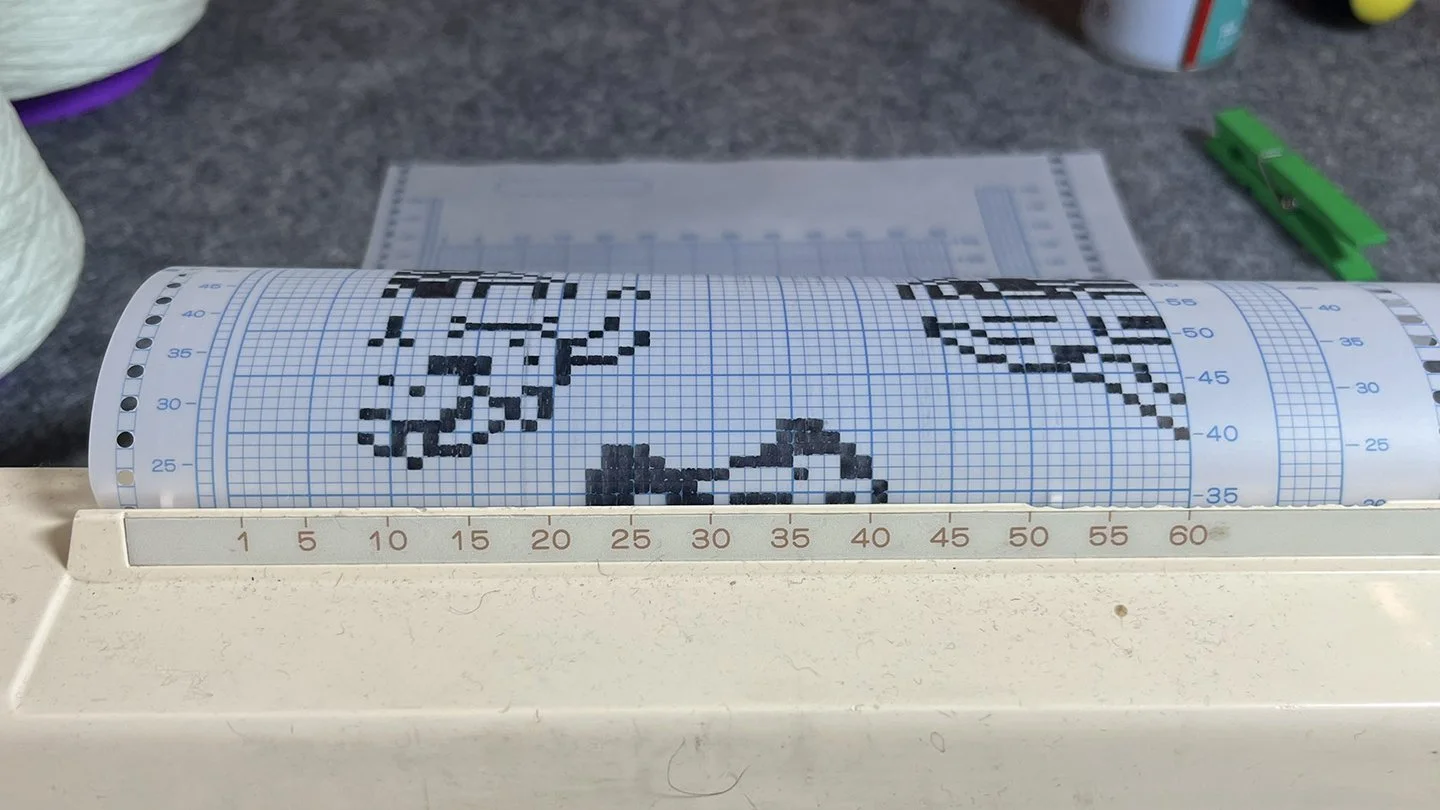
Please see MACHINE KNITTING for examples of pieces completed with this grid input.COMPUTERIZED INPUT (AYAB)
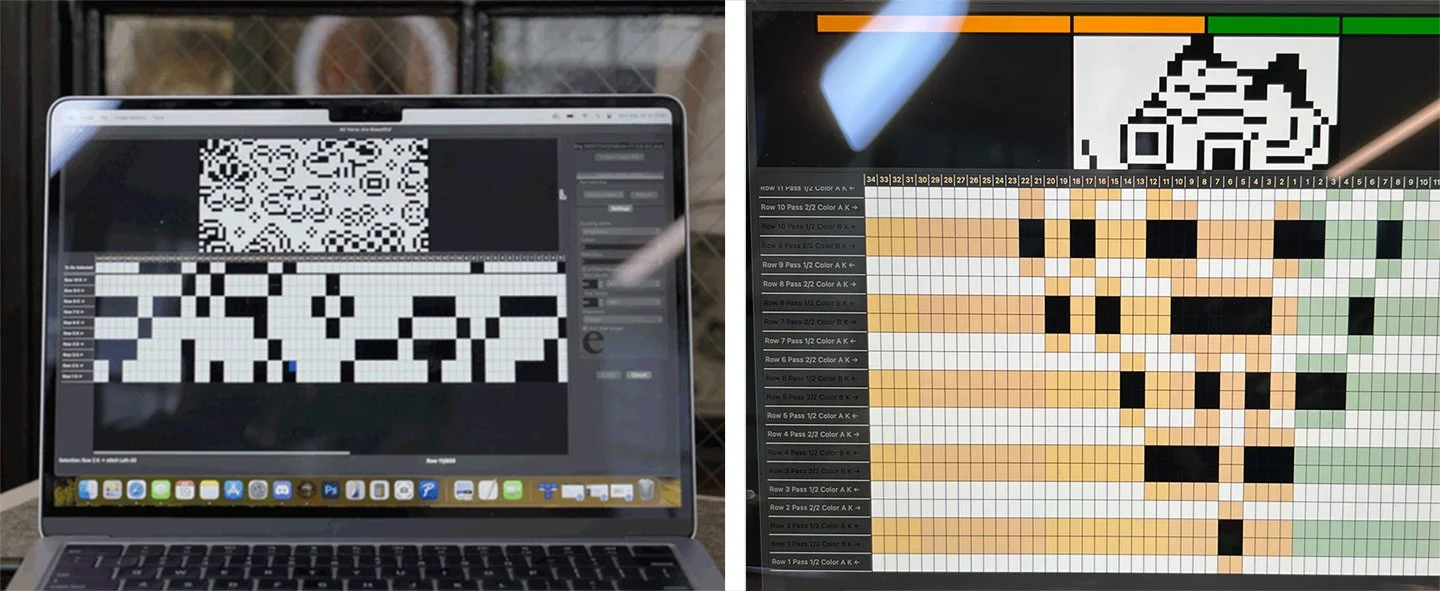
A view of the AYAB 1.0 interface on the computer for two-color stranded-yarn knitting (left) and two-color double bed jacquard (right), showing the 2-color bitmap file converted into needle selections (black) for the knitting machine (2025).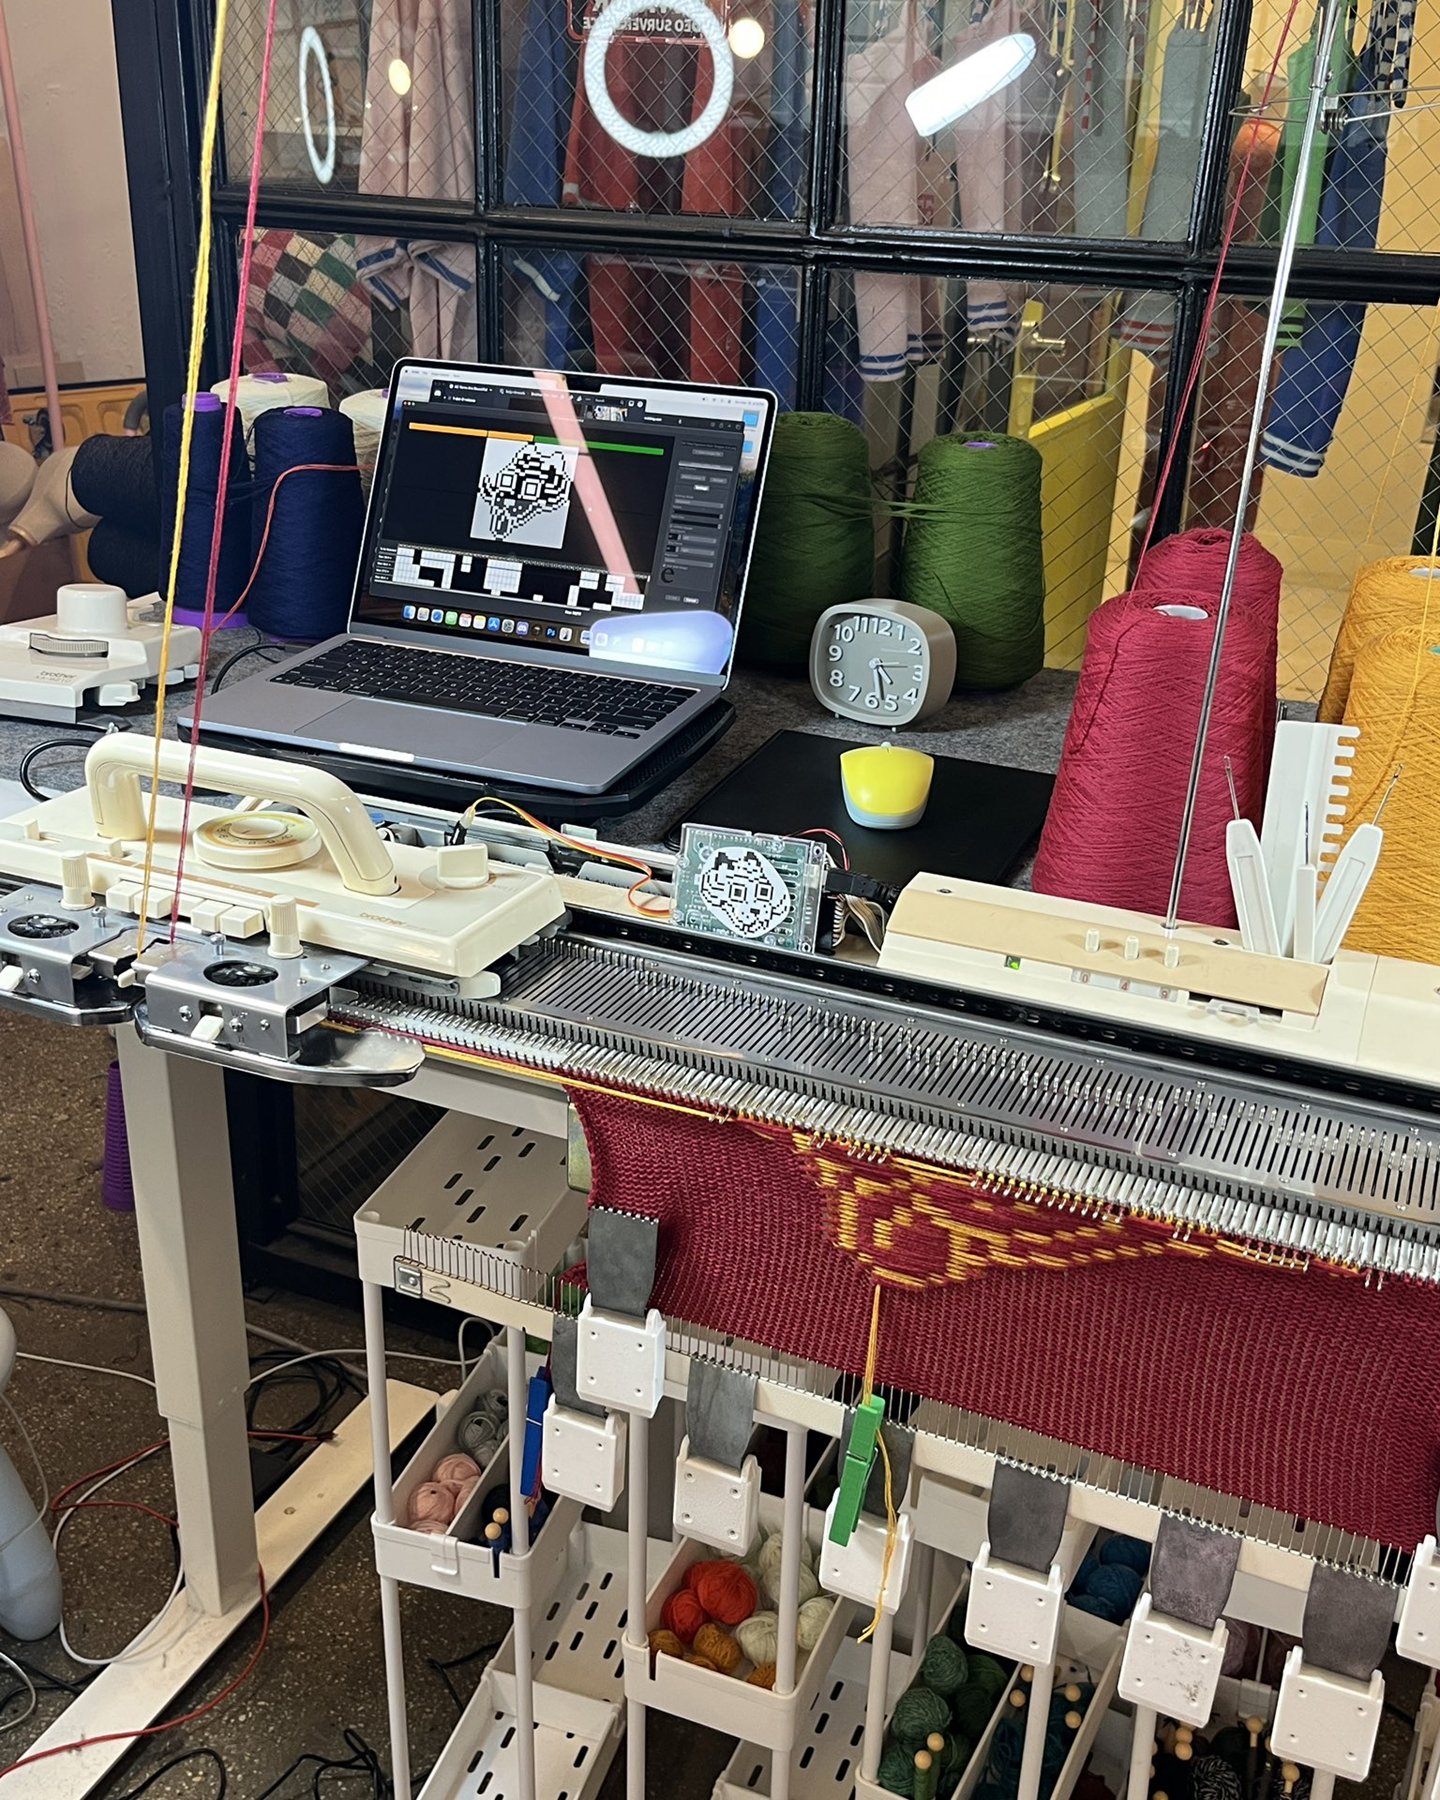
A view of the knitting machine hooked up to the AYAB hardware and software interface.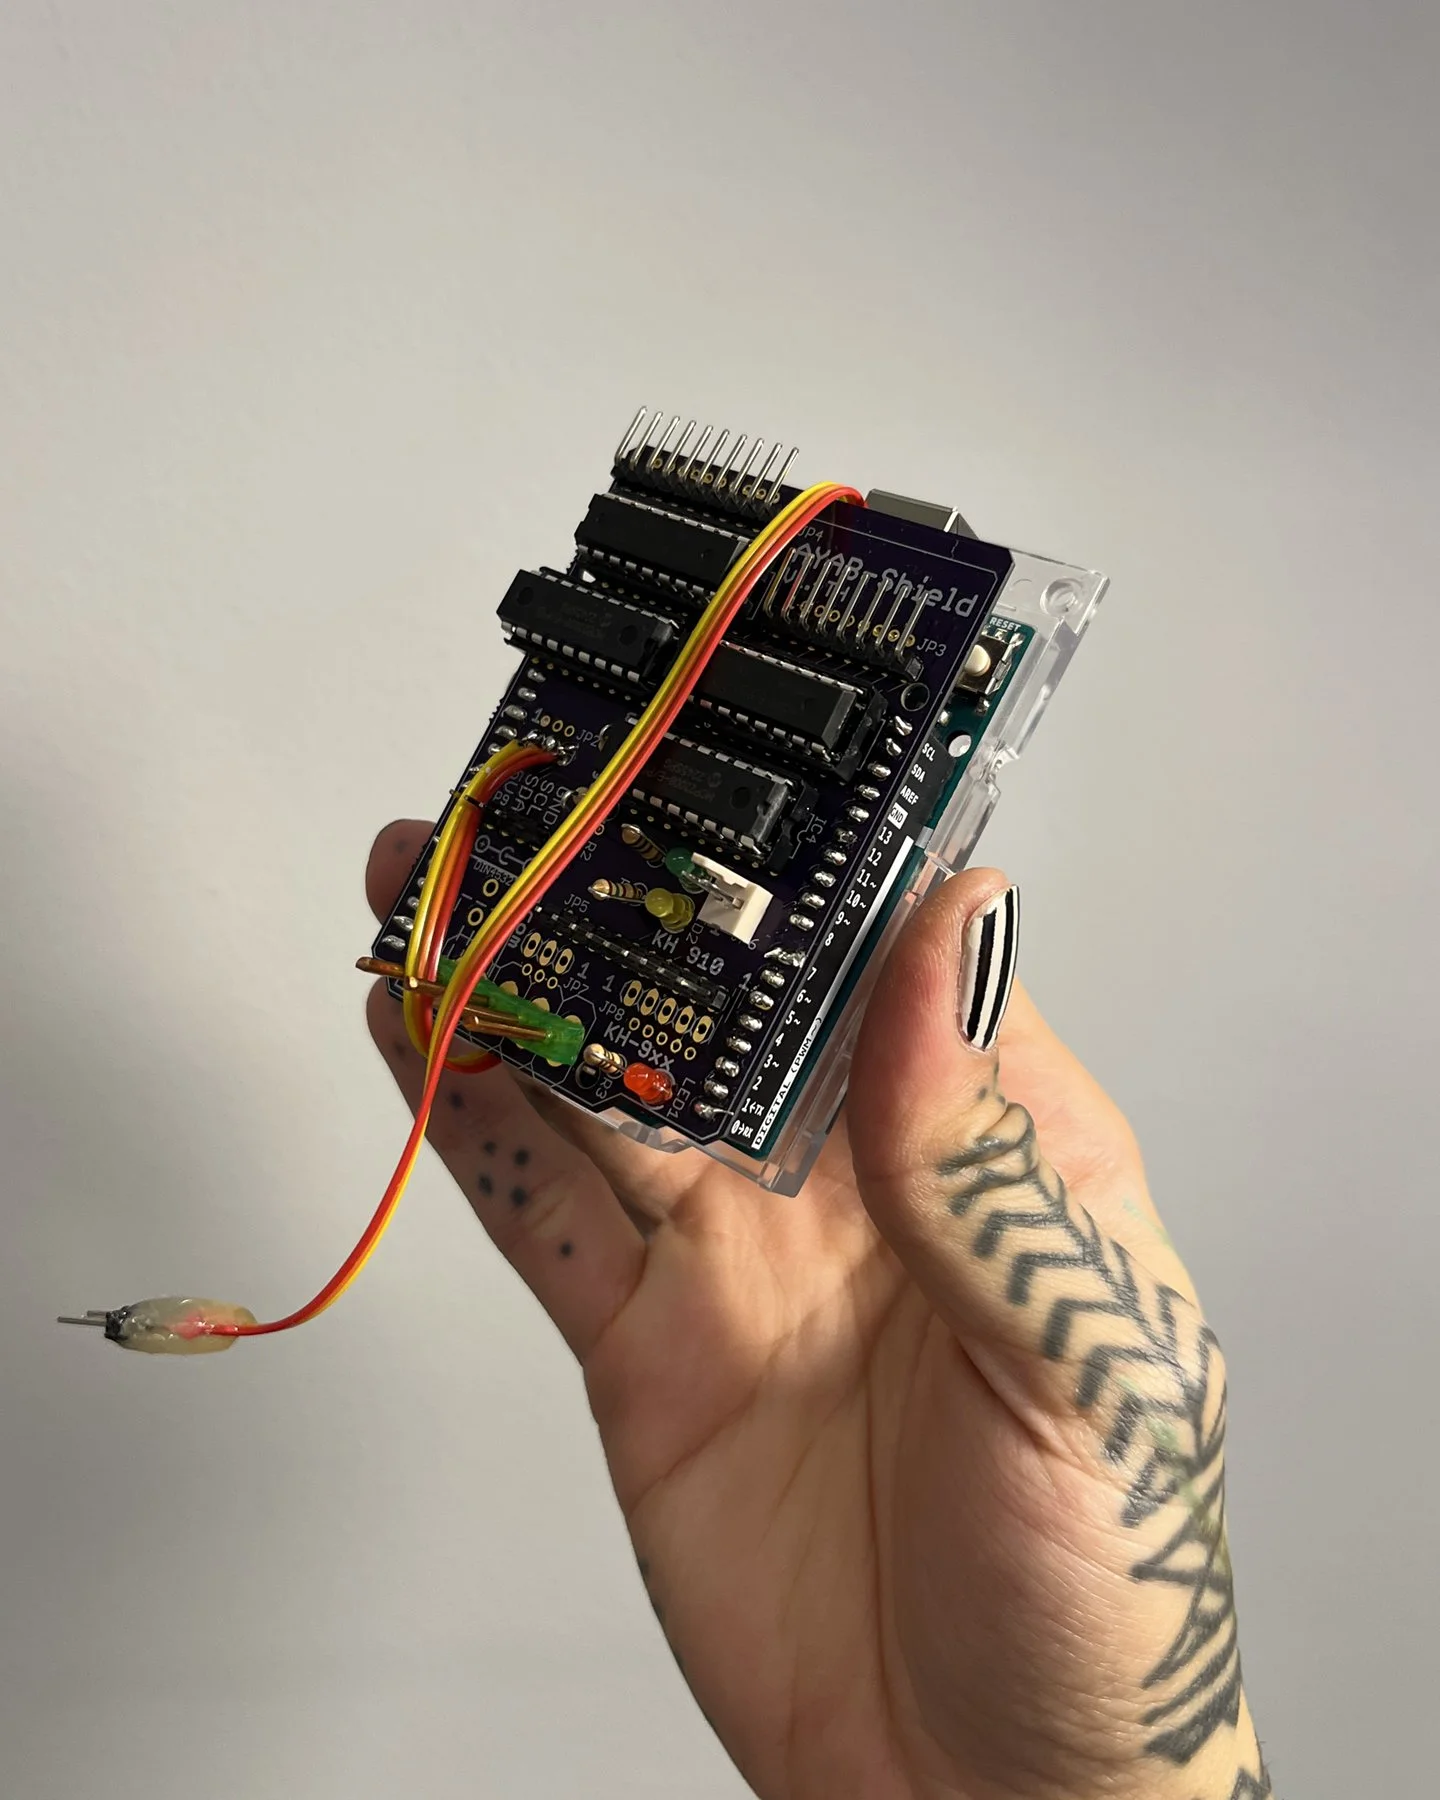
The AYAB hardware connected to the Arduino board, which replaces the hardware and software on the knitting machine.Please see UNDULATION and MACHINE KNITTING for examples of pieces completed with this grid input.GRAPHS FOR DIGITAL OUTPUTS
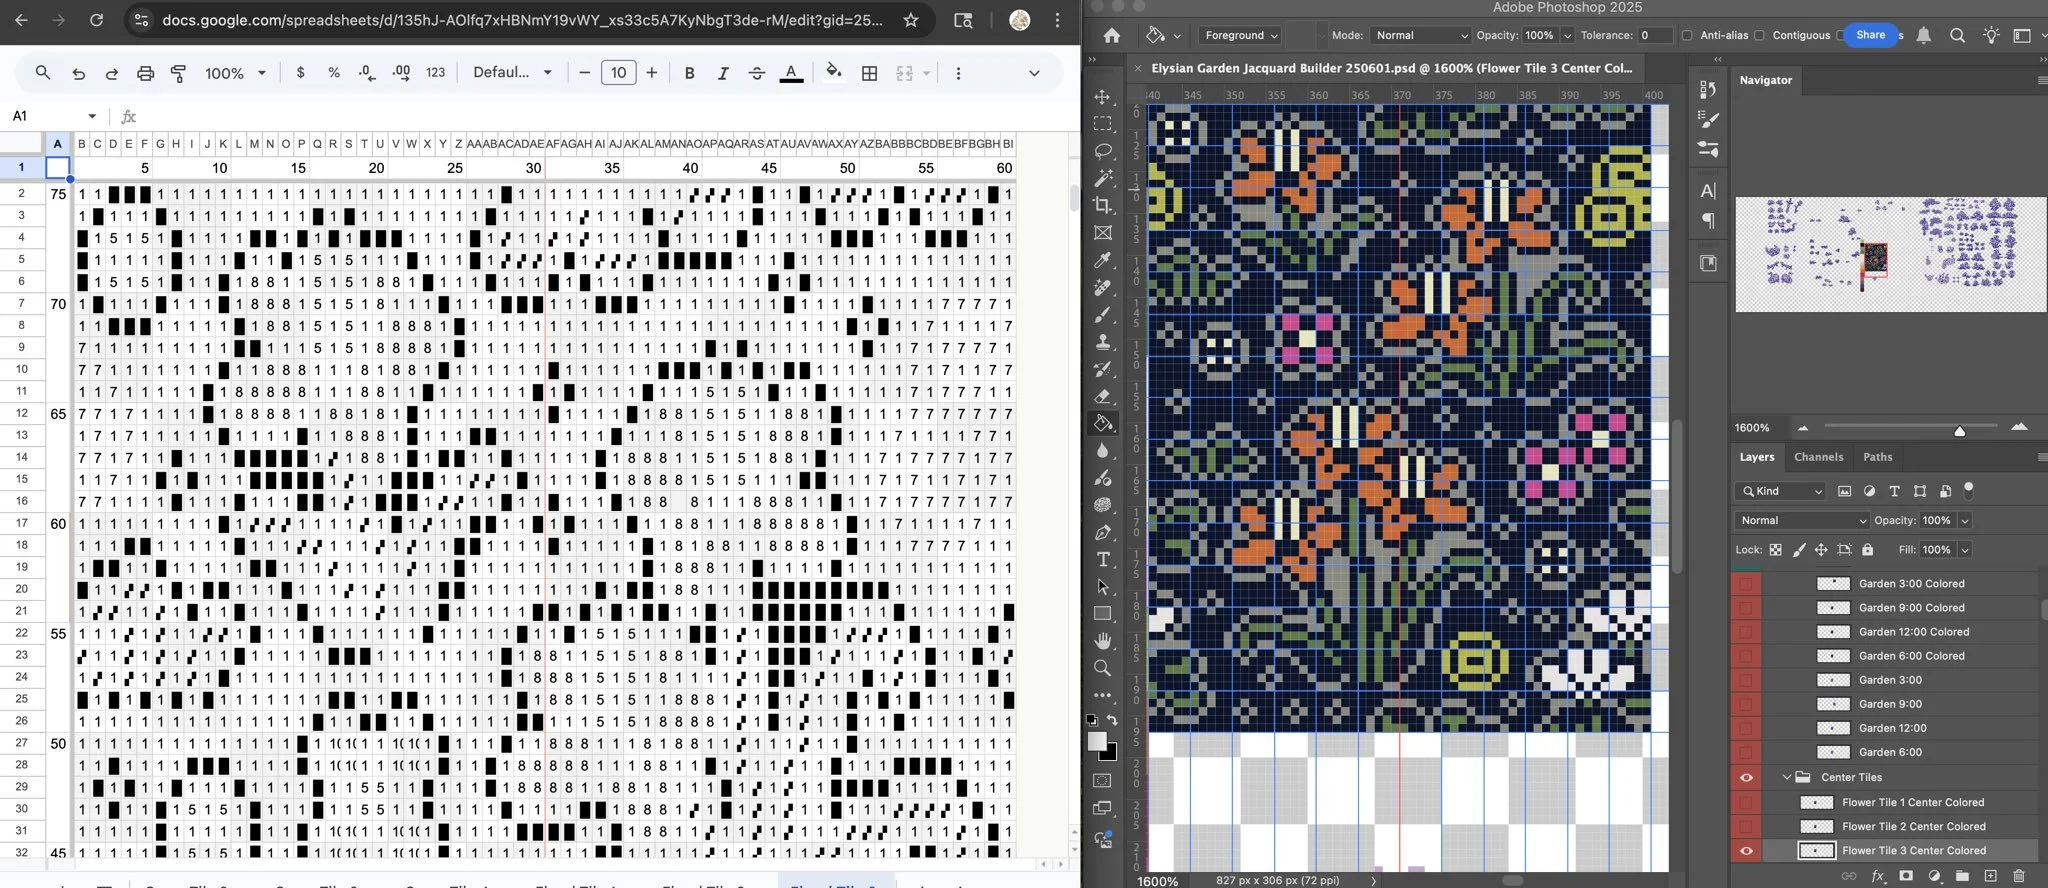
A digital pixel design is charted for digital output as a matrix of numerical values, each corresponding to a color. Like intarsia knitting where each color must be placed by hand over needles, the artwork is charted by hand into the graph. Programs: Google Sheets (left), Adobe Photoshop (right) (2025).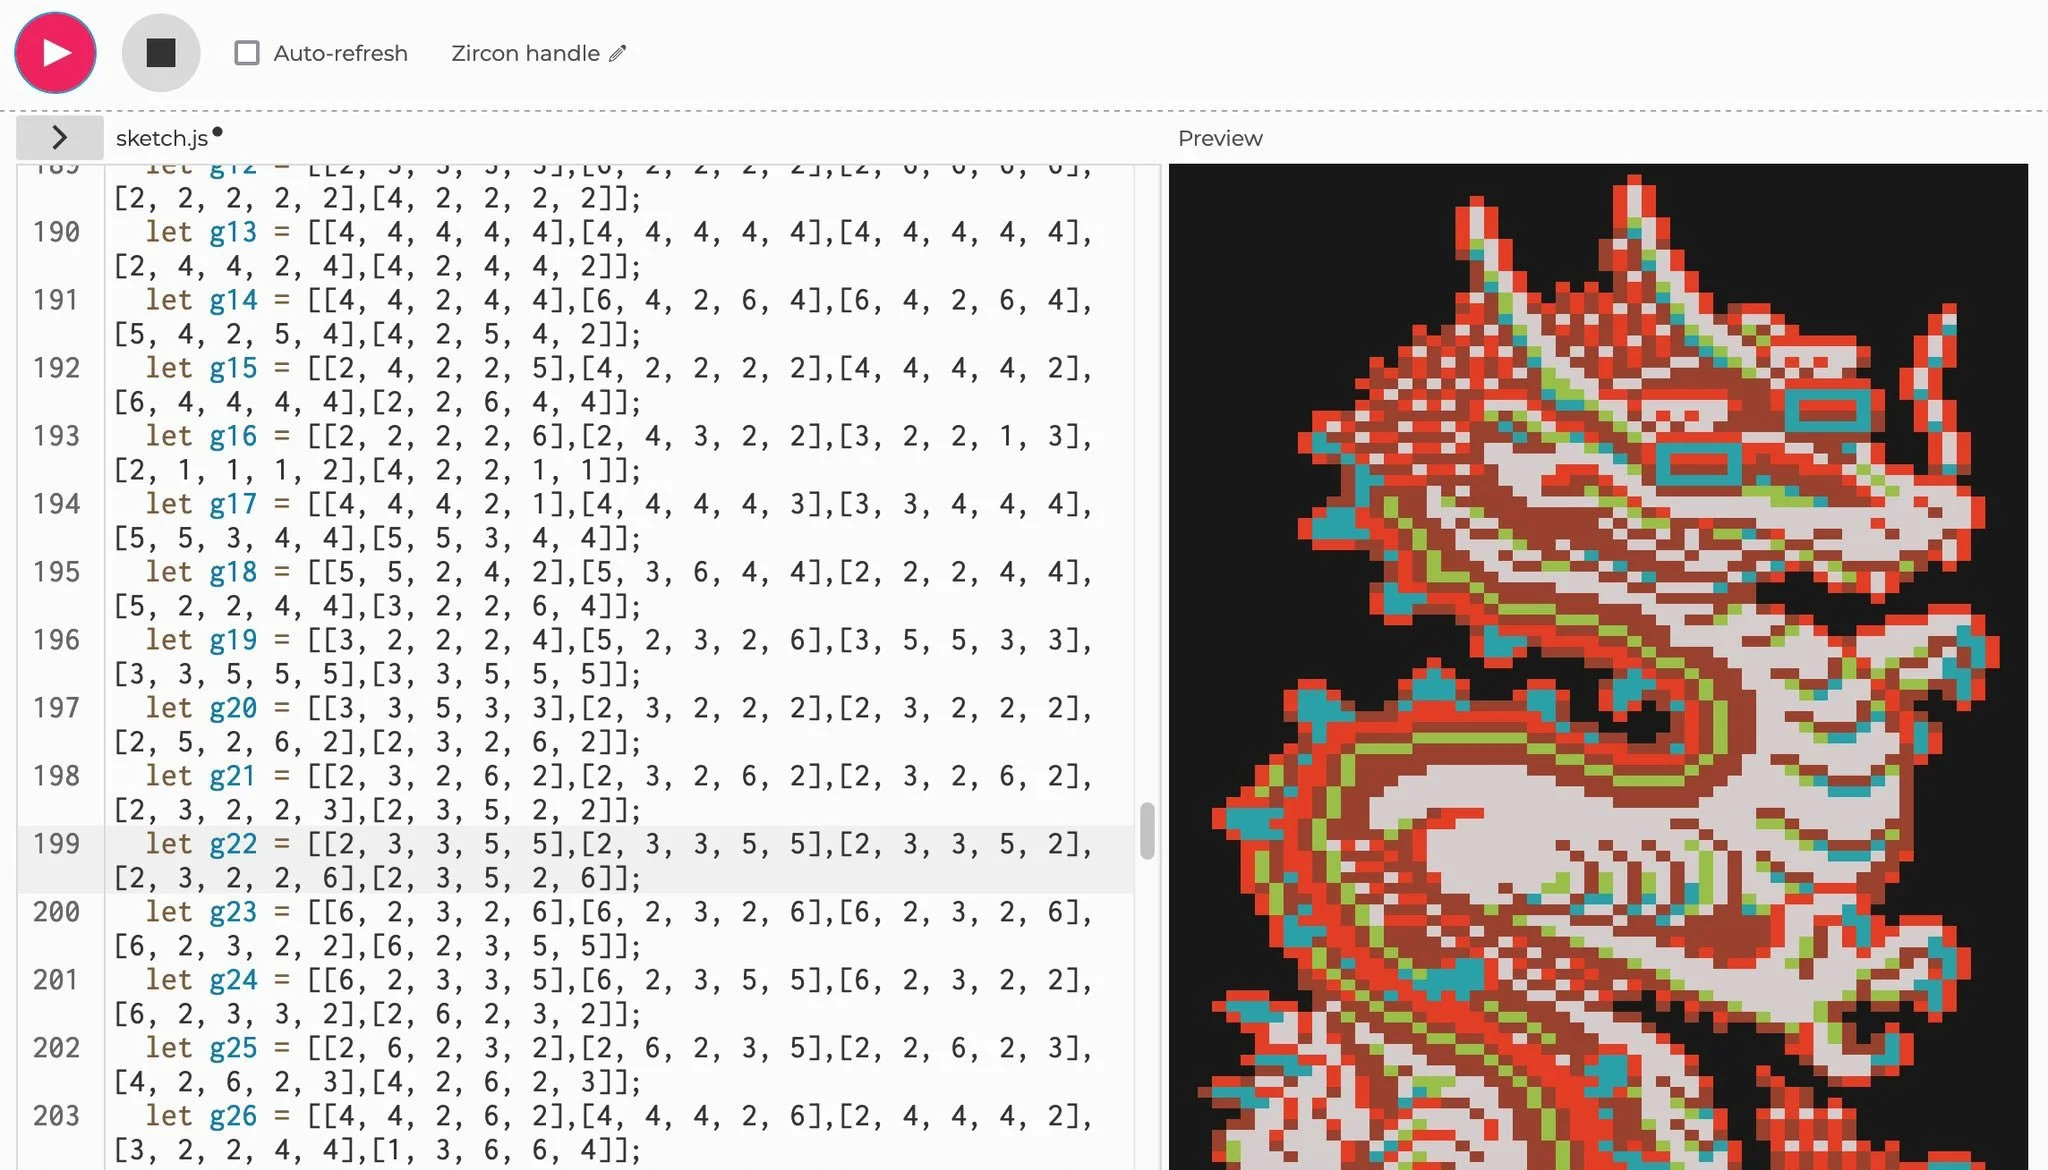
The graph in Google Sheets is formatted into appropriately sized matrices suitable for JavaScript (p5js). Instructions written in code generate the image from the matrices. These matrices contain values 5 columns wide and 5 rows tall each.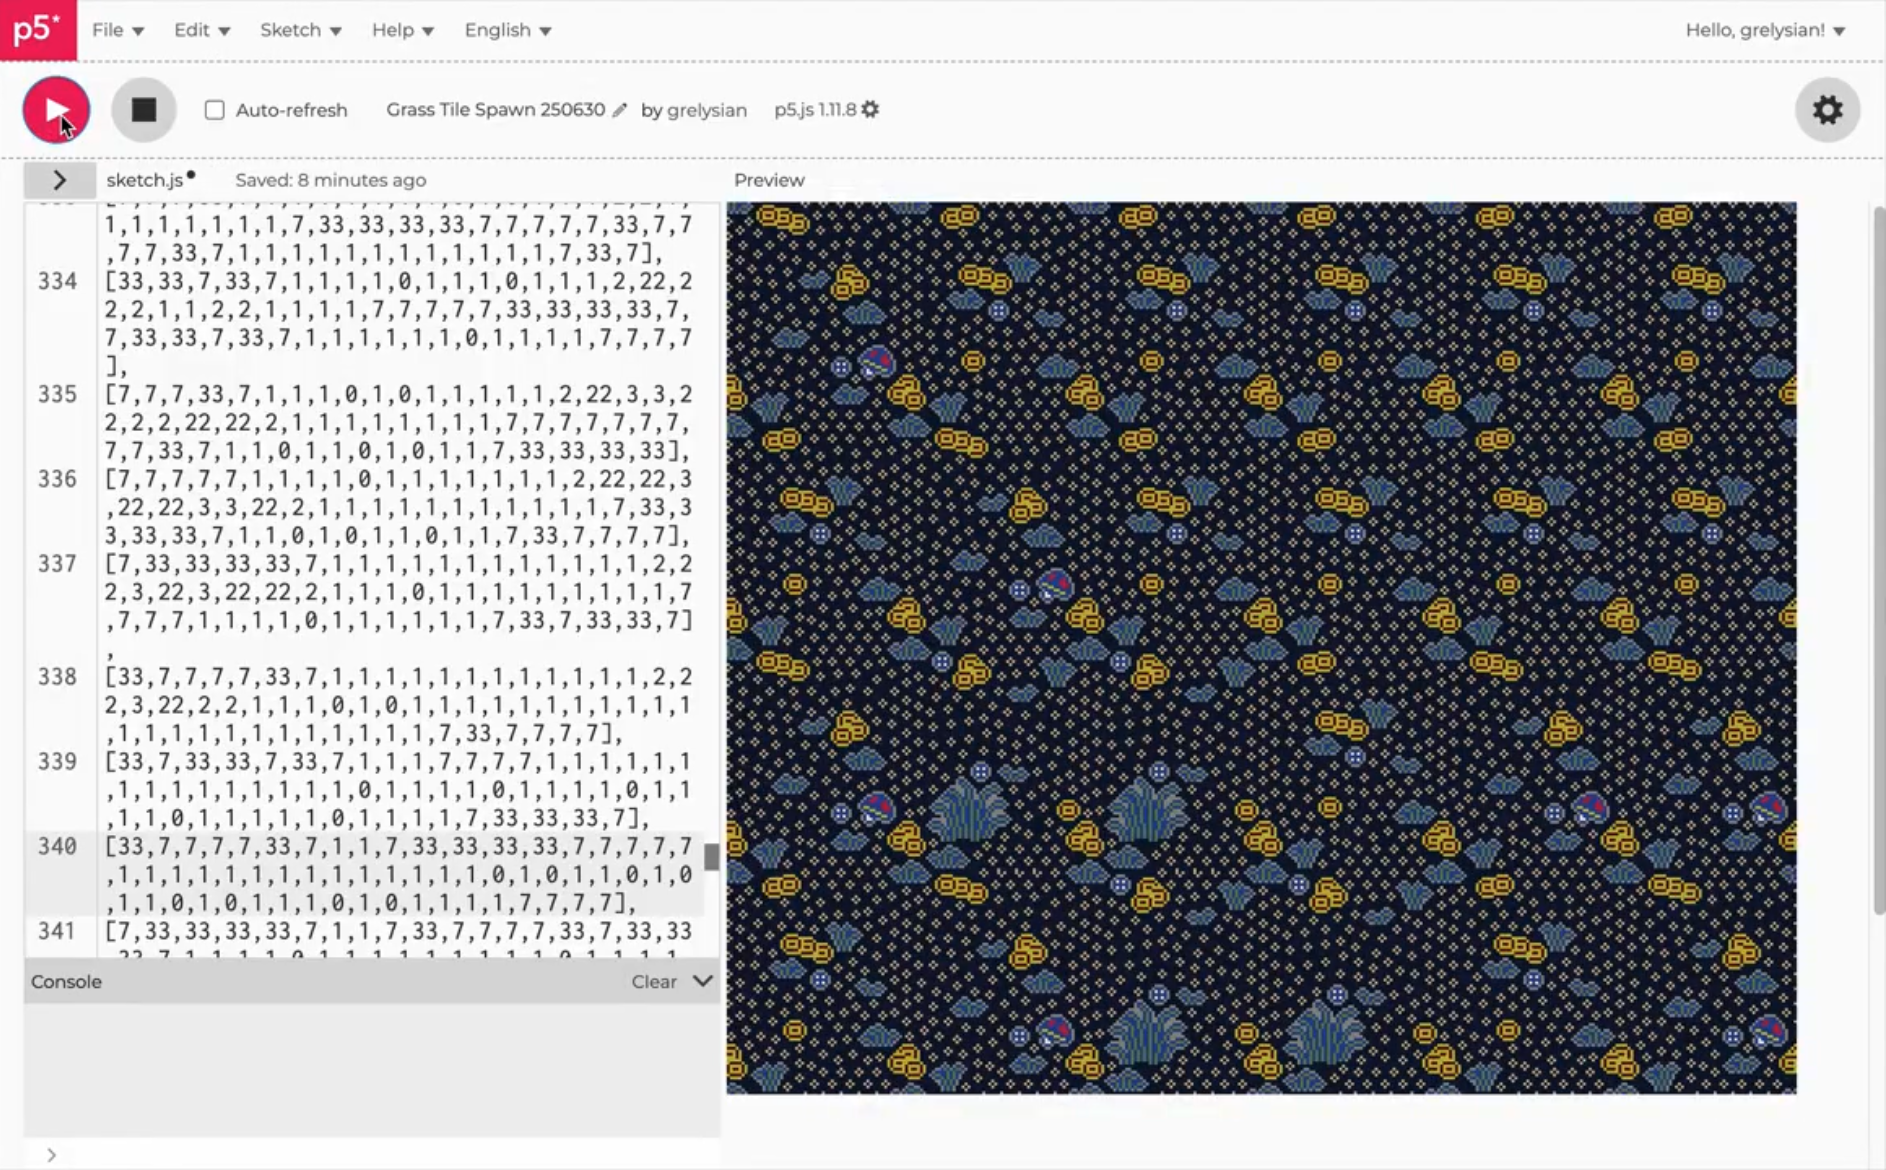
Any number of individual matrices, no matter how large, can be instructed to be placed individually on a larger grid. These matrices contain values 60 columns wide and 75 rows tall each, placed on a larger grid 6 columns wide and 4 rows tall. (Tigerbob Charm Packs, Tigerbob Mystery Garden, Undulation)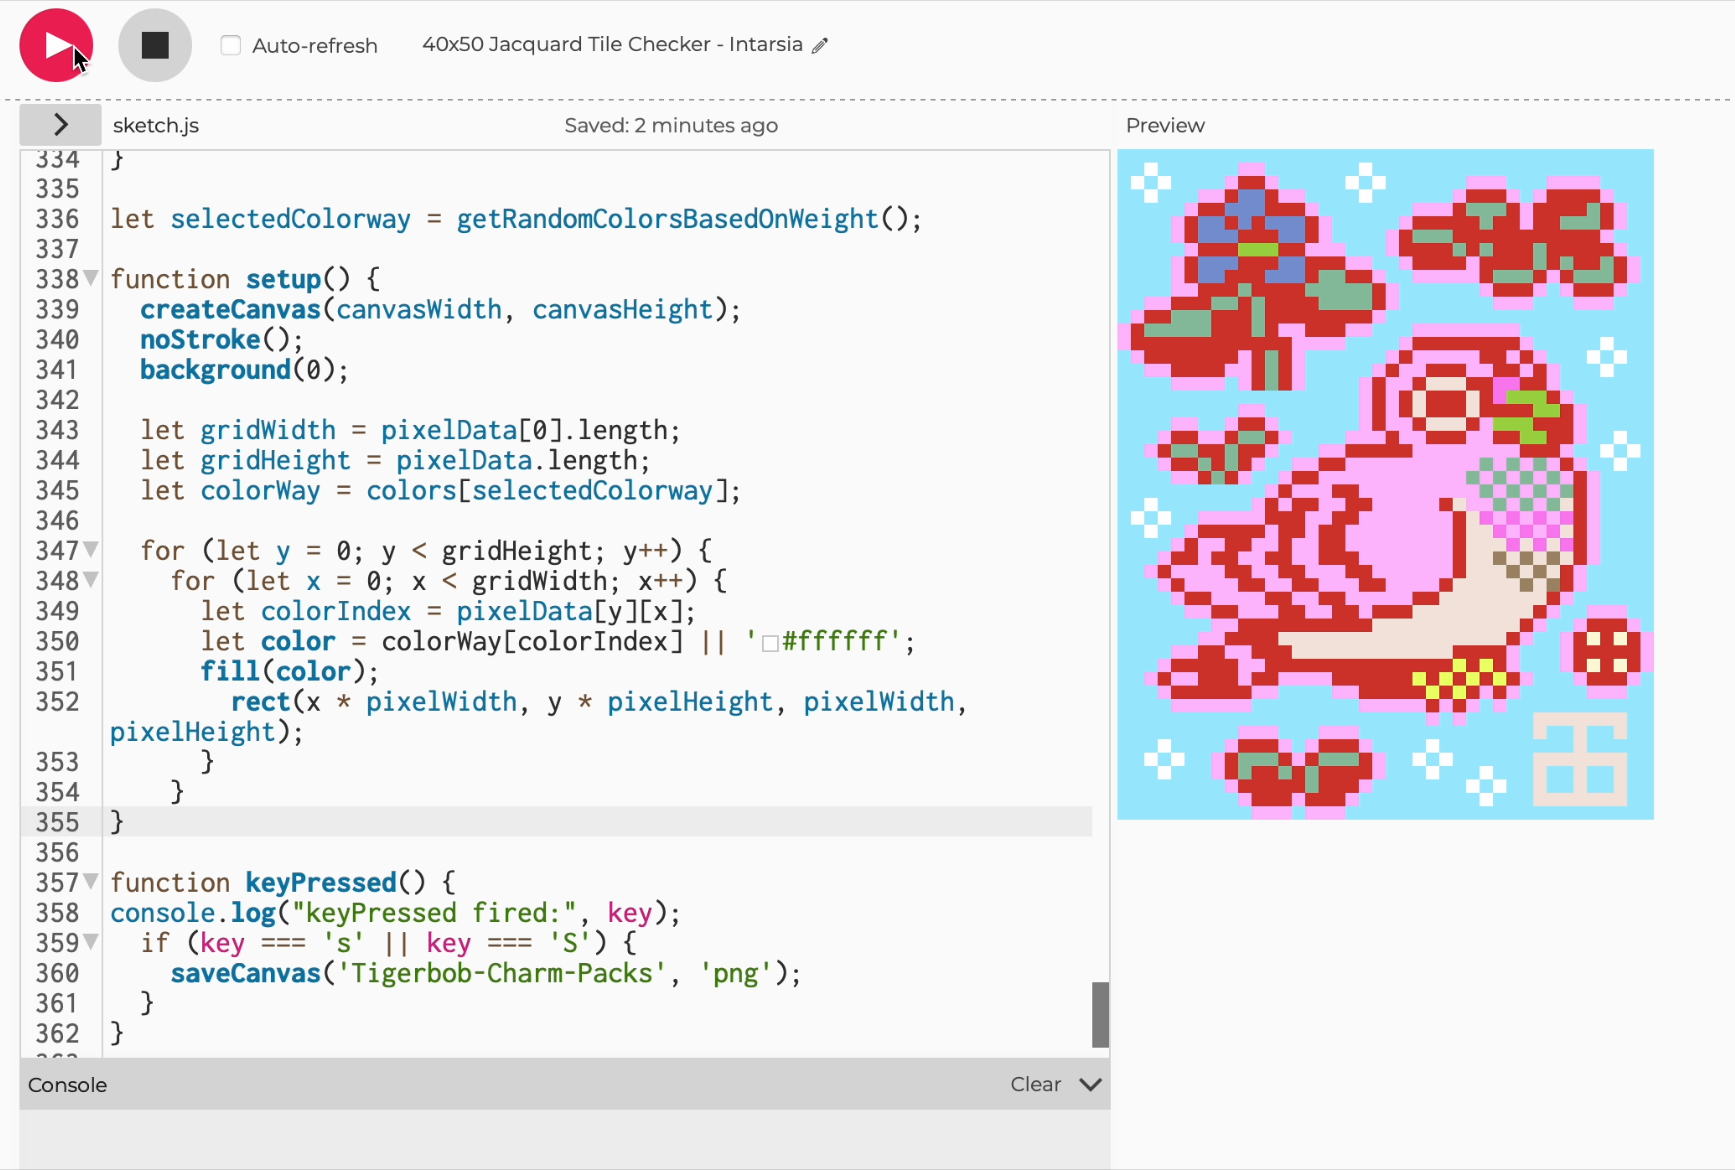
This process is not only used for completed artwork. Once written, matrices can also be assigned any color value, which can assist with the textile or digital design.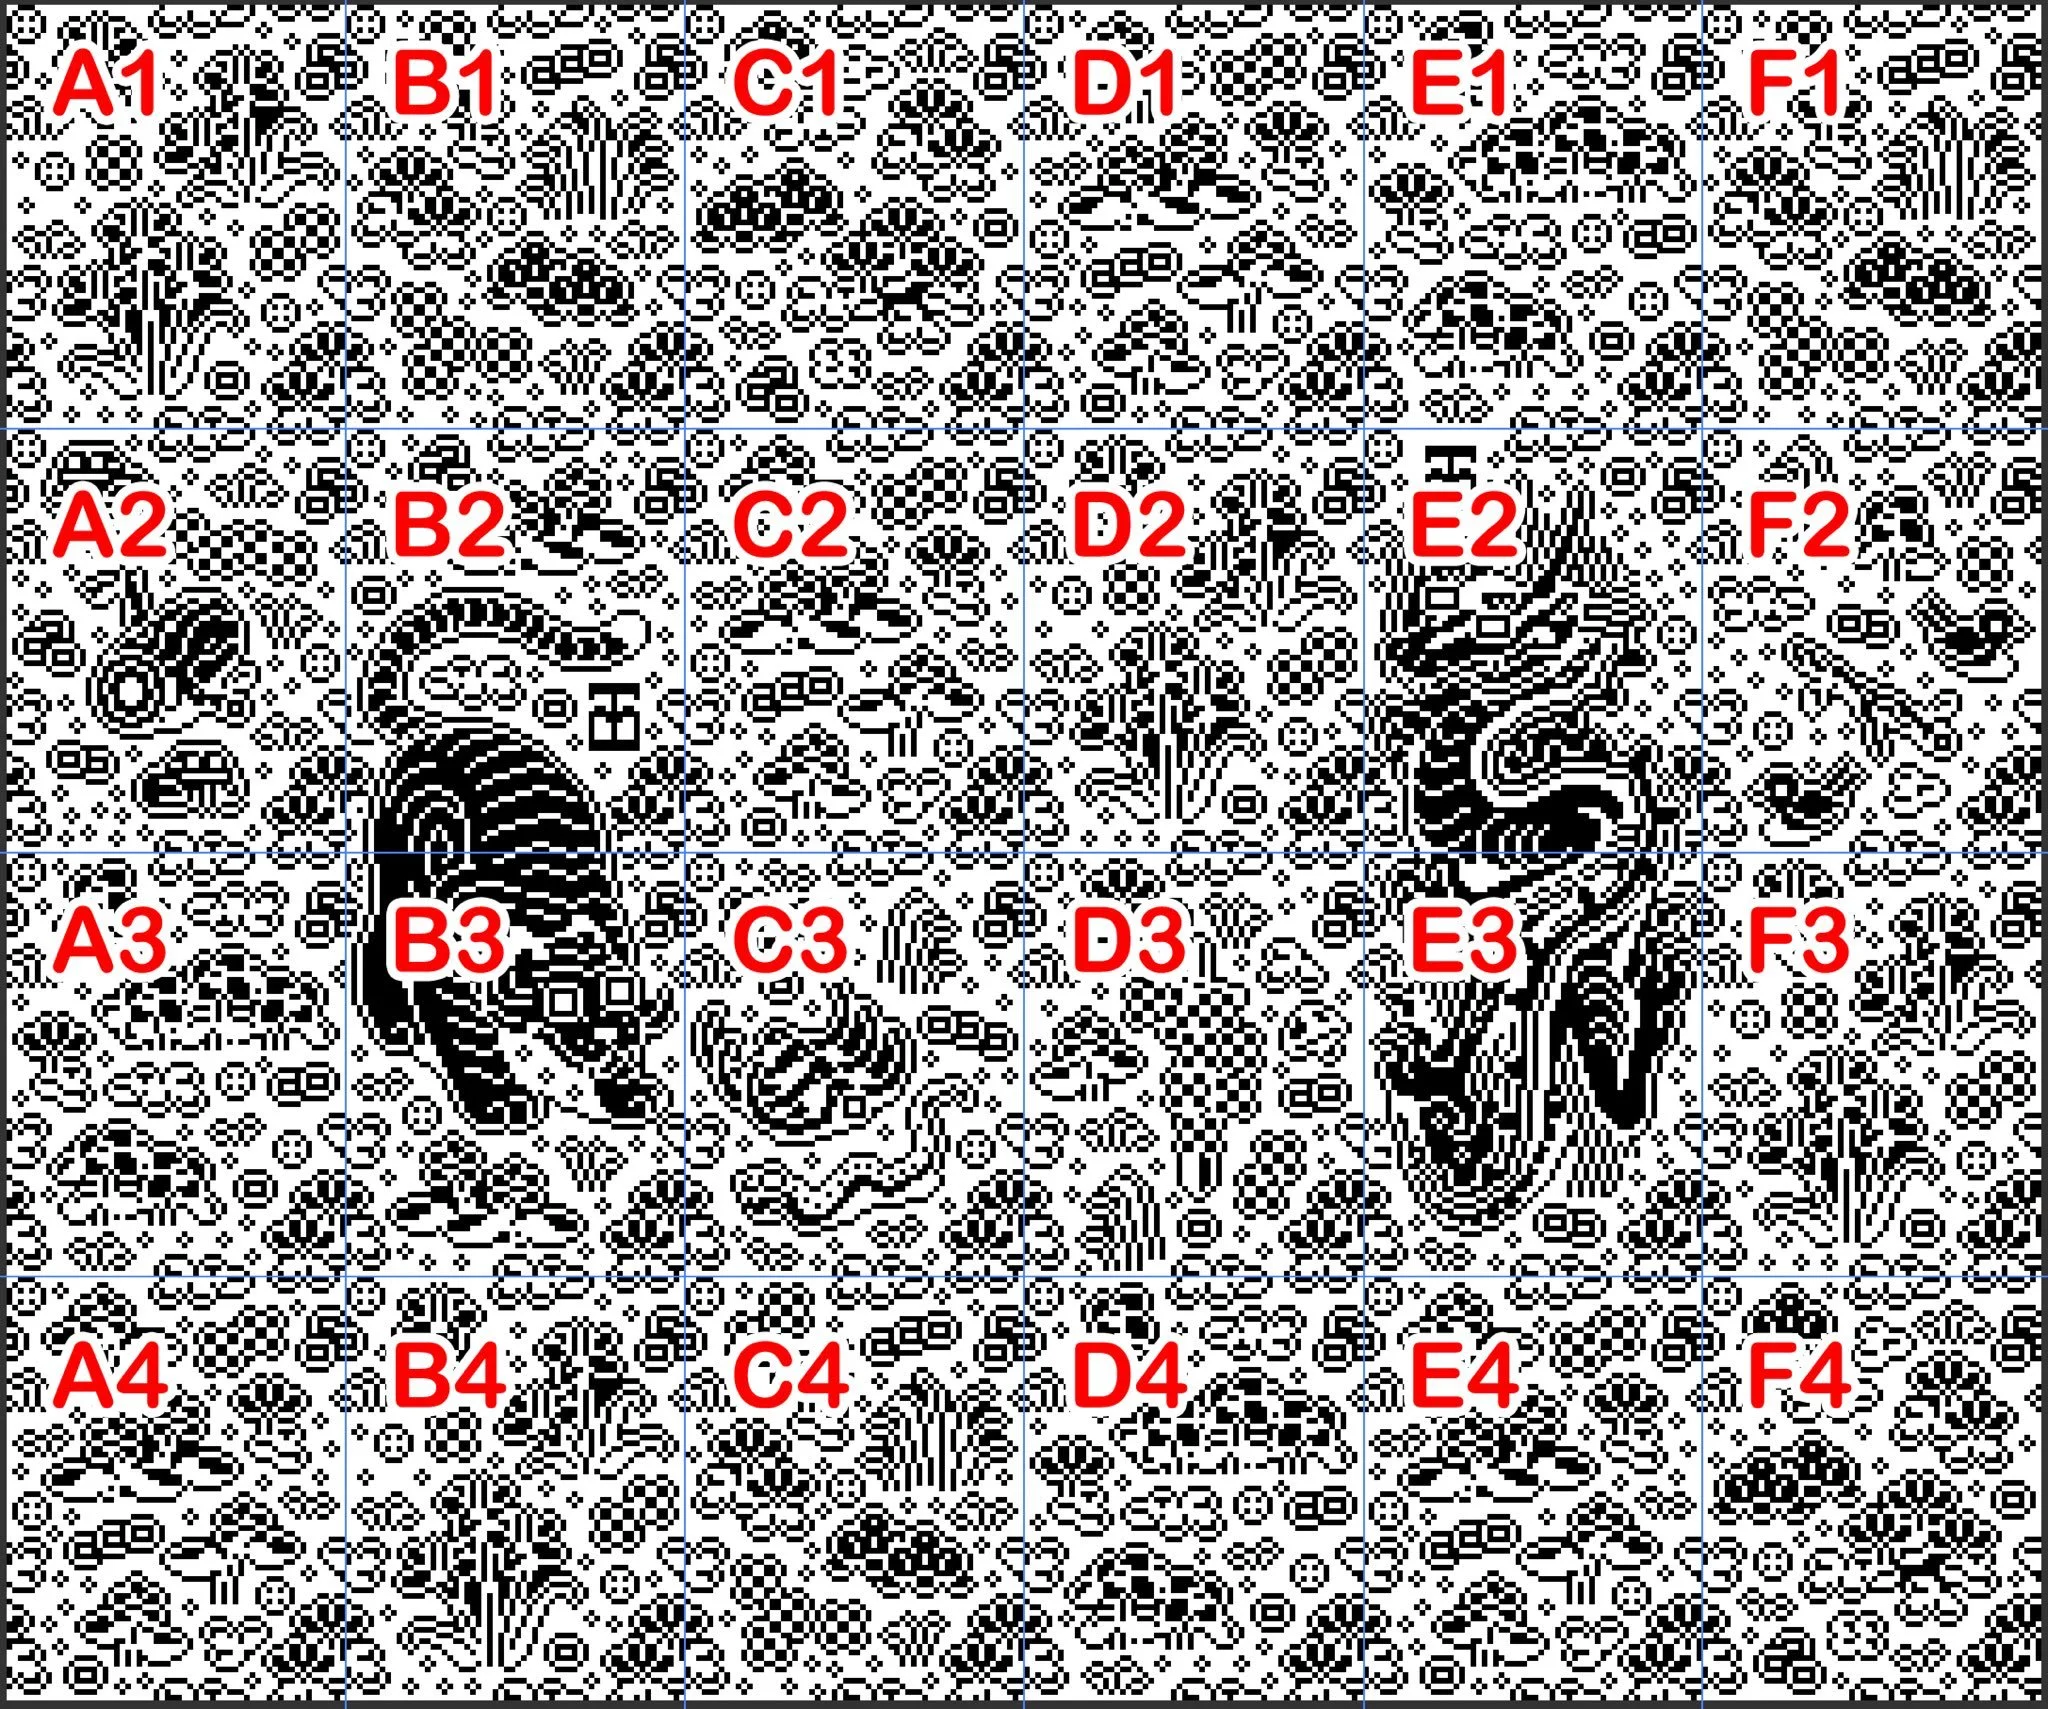
Once produced, images be output in the appropriate charted format for knitting. (Undulation)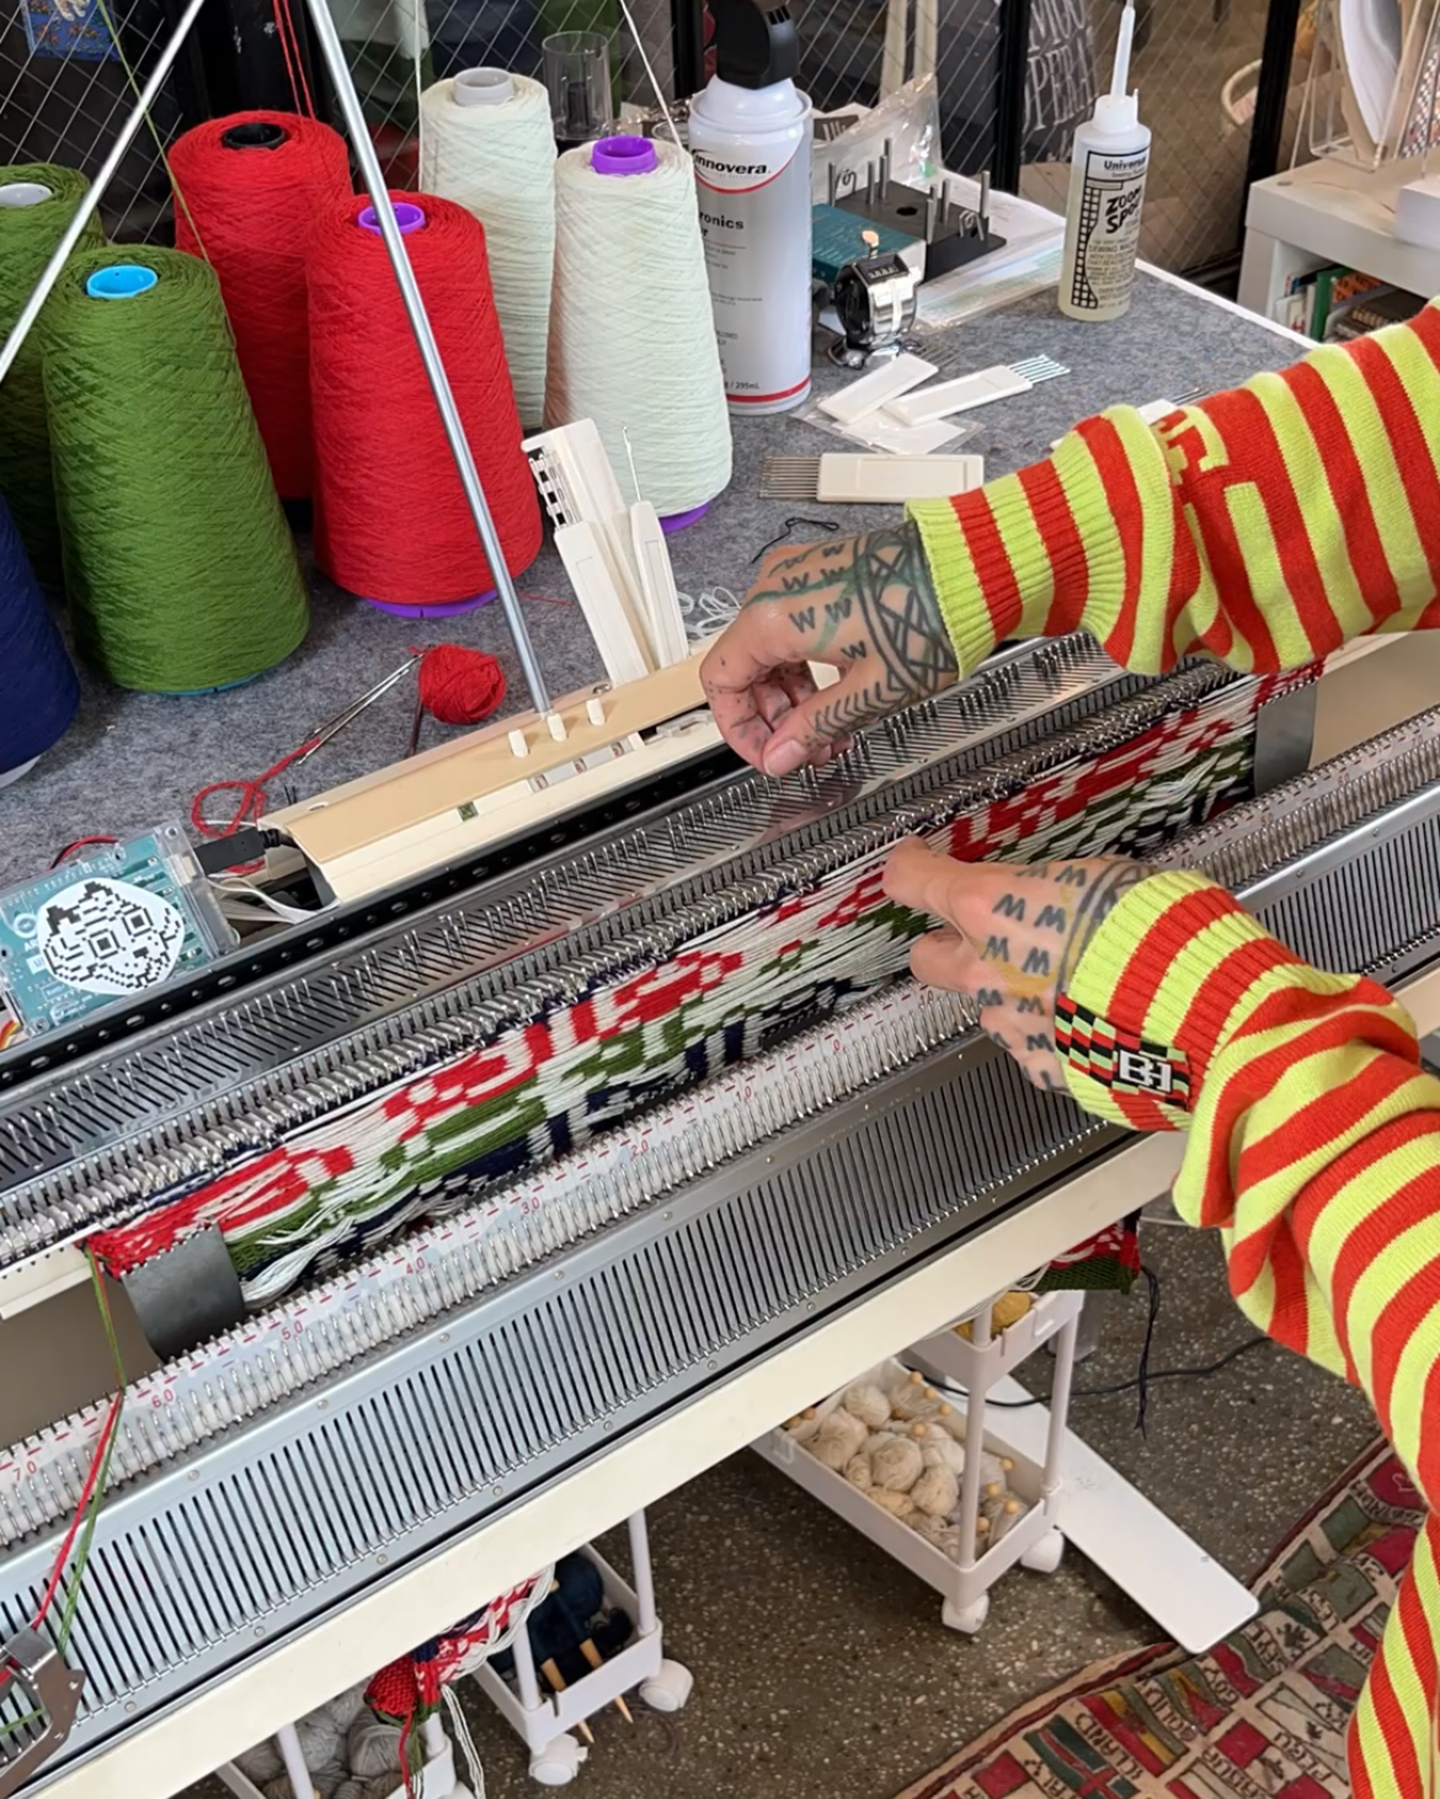
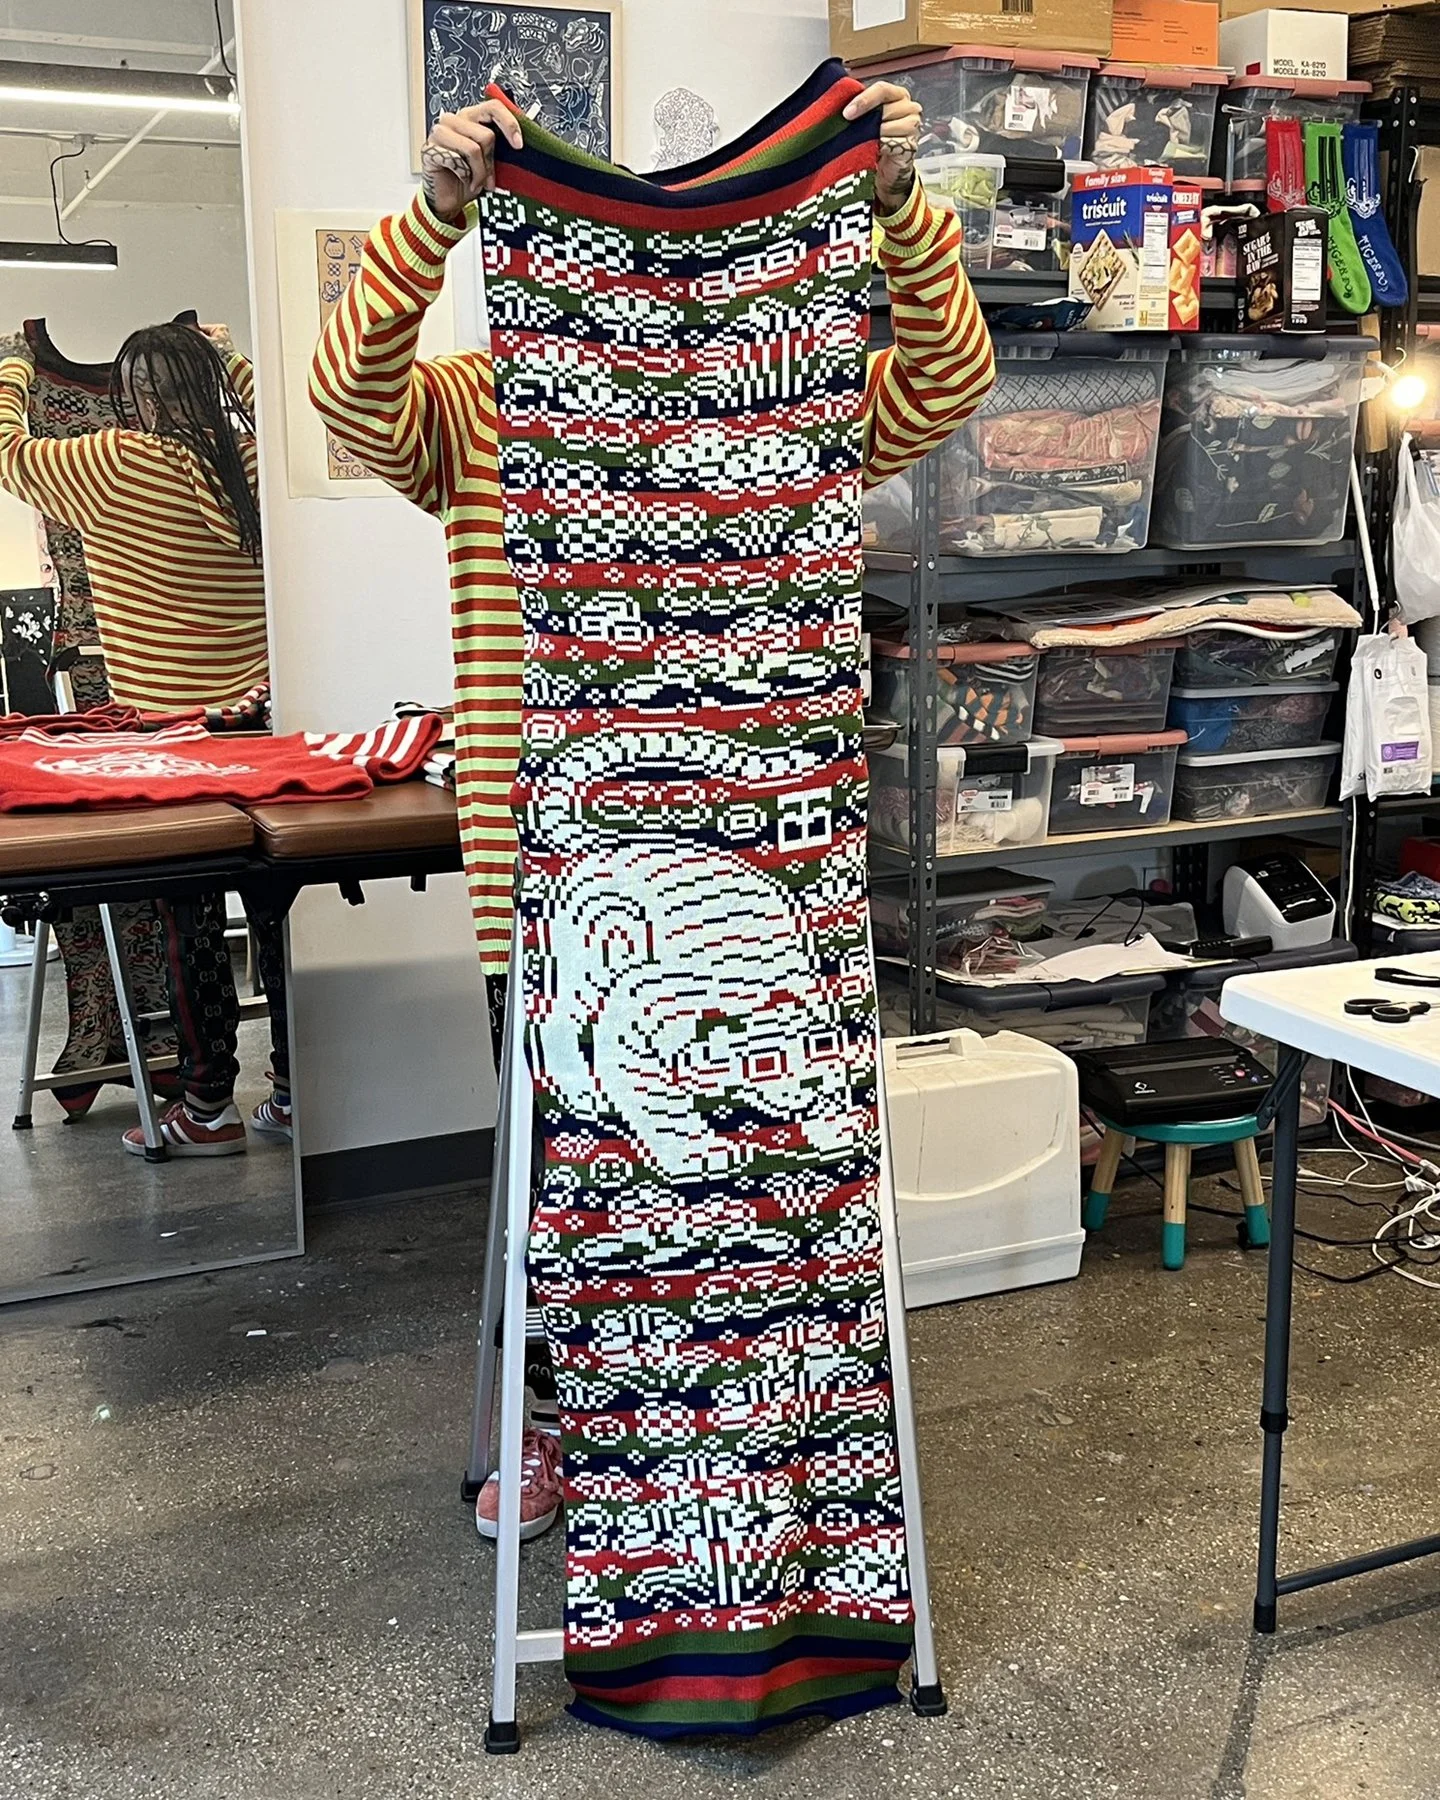
Please see UNDULATION, TIGERBOB MYSTERY GARDEN, and TIGERBOB CHARM PACKS for examples of pieces completed with this grid input.PROTOTYPE:
CTRL+C, CTRL+V AND GOOGLE SHEETS
Prior to using spreadsheets to create matrices, I explored artwork made directly on Google Sheets. I created three pieces dated 2022-2023, called the Iteration series, exploring pixel art in grid structures. The projects were released as digital collectibles.The Iteration series are a set of gif animations produced in Google Sheets and animated in Adobe Photoshop. The process included a copy/paste text method to build shapes and color. The pieces include color and unicode text in cels and use a strobe-like animation effect seen in Tigerbob Charm Packs.
Iteration 0, for Proof Grails I, Google Sheets & Adobe Photoshop, 2022
Iteration 1, for The NFT.NYC 2022 Diversity of NFTs Art Collection, Google Sheets & Adobe Photoshop, 2022
Iteration 2, one of two pieces from BEHEADED for Moonbirds Diamond Exhibition, Google Sheets & Adobe Photoshop, 2023This piece alludes to Tigerbob’s arcane origin by referencing Grimoire (2019).